
USD/SEK
USD/SEK
Last updated:
Jul 24, 2023
| Low | |
| High |
Note: Low and High figures are for the trading day.
This is the forex quote for the U.S. Dollar against the Swedish Krona. In this quote, the value of one USD (the 'base currency') is quoted in terms of SEK (the 'counter currency'). The pair is sensitive to relative monetary policy expectations for the Federal Reserve vs. the Riksbank, Sweden's central bank. The Dollar has also acted as a safe-haven asset at times of market stress, meaning the USD/SEK exchange rate can be sensitive to swings in broad-based investor sentiment trends. Sweden is also a prolific exporter to the UK and the Eurozone, meaning developments in those economies can at times influence SEK price action.
Advertisement
News & Analysis

Swedish Krona Holds the High Ground as US Return from Holidays. Lower EUR/SEK?
2023-02-21 04:30:00
Swedish Krona Bolts Higher, Norwegian Krone Follows. Where to for EUR/SEK and EUR/NOK?
2023-02-10 02:00:00

US Dollar Surges as Nickel Leads Commodity Chaos and Stocks Drop. Will DXY Index Dip?
2022-03-08 06:00:00
USD/NOK Rates Hit New Low; USD/CHF, USD/SEK Rates See Improved Bullish Momentum
2021-09-27 17:45:00
USD/CHF, USD/SEK Lose 2021 Uptrends; USD/NOK Retains Bear Flag Breakout Posture
2021-05-10 14:10:00
USD/NOK Remains in Bear Flag; USD/CHF, USD/SEK Break Recent Uptrends
2021-04-08 13:19:00
OMX 30 Near All-Time High, USD/SEK Continues Steady Depreciation
2020-12-17 10:30:00
Real Time News

Jul 18, 2023
Follow
🇺🇸 Net Long-term TIC Flows (May)
Actual: $25.8B
Expected: $110.2B
Previous: $127.8B
https://www.dailyfx.com/economic-calendar#2023-07-18
Jul 18, 2023
Follow
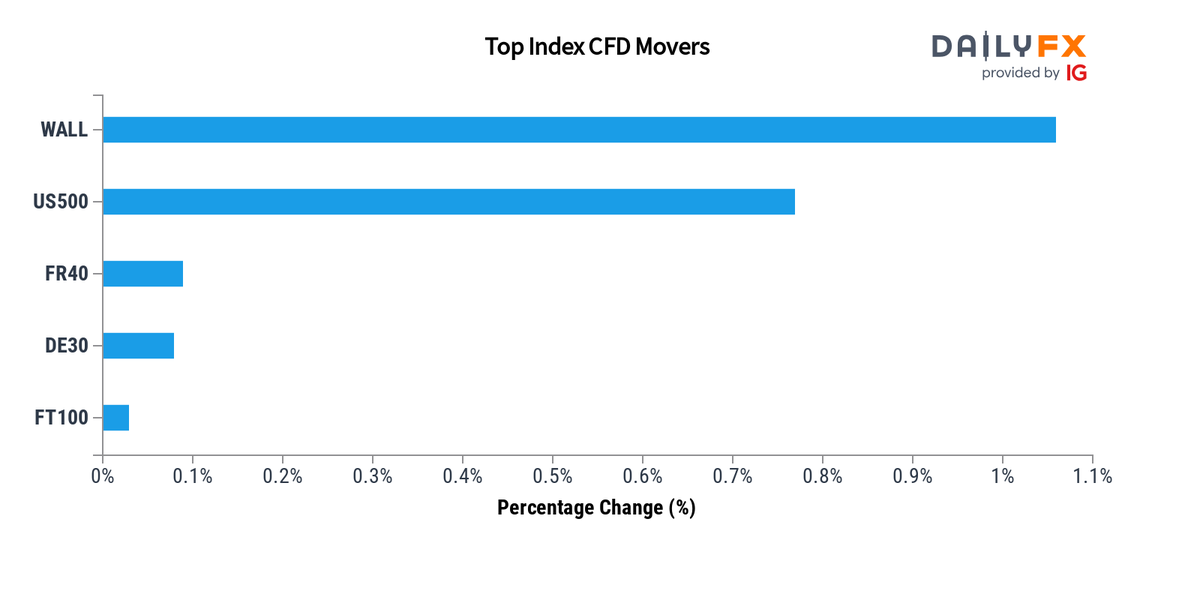
Indices Update: As of 20:00, these are your best and worst performers based on the London trading schedule:
Wall Street: 1.06%
US 500: 0.77%
France 40: 0.09%
Germany 40: 0.08%
FTSE 100: 0.03%
View the performance of all markets via https://www.dailyfx.com/forex-rates#indices https://t.co/ts7HI7zcYb
Jul 18, 2023
Follow
Heads Up:🇺🇸 Net Long-term TIC Flows (May) due at 20:00 GMT (15min)
Expected: $110.2B
Previous: $127.8B
https://www.dailyfx.com/economic-calendar#2023-07-18

Jul 24, 2023
Follow

Advertisement