
USD/CNH
USD/CNH
Last updated:
Jul 24, 2023
| Low | |
| High |
Note: Low and High figures are for the trading day.
This pair represents the US Dollar against offshore Chinese Renminbi. The Renmibi is also often referred to as the Yuan in its unit designation and uses the letters CNY when trading inside of China. The Yuan used to be pegged to the US Dollar but is now allowed to trade a limited distance against the reserve currency on a daily basis. China is the world's largest exporter and remains the second largest economy, behind the United States. China has used its control over its exchange rate to help ward off global financial crisis and maintain its dominant trade position - an effort that has drawn accusations that it is manipulating its currency.
Advertisement
News & Analysis

USD/CNH, Copper Outlook: Worrisome Chinese Data Takes Hold
2023-07-17 15:10:35

Australian Dollar Holds Losses After China GDP; How Much More Downside in AUD/USD?
2023-07-17 02:00:00

Q3 Top Trade Opportunity: US Dollar May Extend its Rally Against the Chinese Yuan in the Third Quarter
2023-07-03 19:00:27
Australian Dollar Buoyed by Solid Data Locally and in China. Higher AUD/USD?
2023-07-03 06:00:00
Japanese Yen is on the Slide as the Fed and Bank of Japan Return to their Corners
2023-06-30 06:00:00
Australian Dollar Boosted by Soft US Dollar and Rosy China Outlook. Higher AUD/USD?
2023-06-27 06:00:00
Chinese Yuan Price Outlook: PBoC Cuts Rates, Leaving Yuan Vulnerable
2023-06-21 11:07:44
Real Time News

Jul 18, 2023
Follow
🇺🇸 Net Long-term TIC Flows (May)
Actual: $25.8B
Expected: $110.2B
Previous: $127.8B
https://www.dailyfx.com/economic-calendar#2023-07-18
Jul 18, 2023
Follow
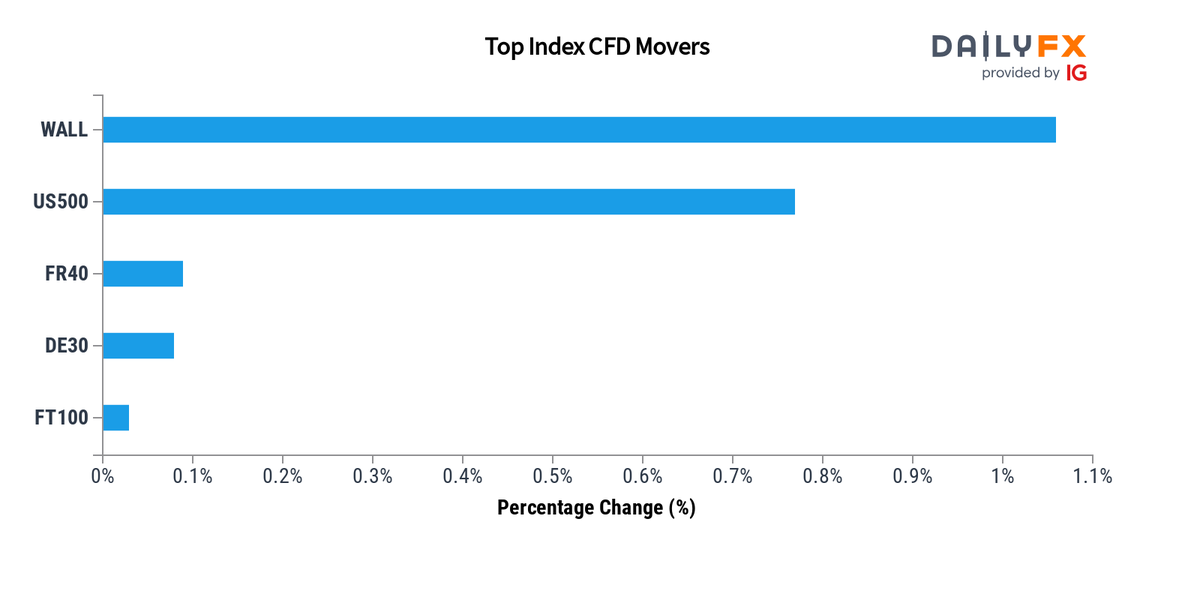
Indices Update: As of 20:00, these are your best and worst performers based on the London trading schedule:
Wall Street: 1.06%
US 500: 0.77%
France 40: 0.09%
Germany 40: 0.08%
FTSE 100: 0.03%
View the performance of all markets via https://www.dailyfx.com/forex-rates#indices https://t.co/ts7HI7zcYb
Jul 18, 2023
Follow
Heads Up:🇺🇸 Net Long-term TIC Flows (May) due at 20:00 GMT (15min)
Expected: $110.2B
Previous: $127.8B
https://www.dailyfx.com/economic-calendar#2023-07-18

Jul 24, 2023
Follow

Advertisement