
USD/CHF
USD/CHF
Mixed
Last updated:
Jul 24, 2023
| Low | |
| High |
of clients are net long.
of clients are net short.
Note: Low and High figures are for the trading day.
The USDCHF currency pair is often called 'The Swissie'. The Swiss Franc is the last Franc still in issuance in Europe. CHF is shorthand for 'Confoederatio Helvetica' Franc, and represents the economy of the neutral nation situation in the center of Europe. Switzerland has long been a key banking center for customers around the world, and the secrecy with which they maintain their banking operations has made them one of the more desireable locations for storing cash. This has helped to bring considerable strength to the Swiss Franc, pressuring exporters from the nation. When the European Debt Crisis enveloped the continent, massive inflows into Swiss Francs made the situation worse until eventually the Swiss National Bank (SNB) created a peg to the Euro at a rate of 1.2 Swiss Francs for every 1 Euro. If the EURCHF currency pair fell below 1.20, the SNB proposed to sell CHF and buy EUR to support the 1.20 floor.
Advertisement
News & Analysis

Dollar Index (DXY) Eyes Deeper Recovery with USD/CHF at 12-Year Lows
2023-07-19 12:27:33

US Dollar Finds Traction While China GDP Misses Estimates. Where to for USD?
2023-07-17 06:00:00

June Jobs Report: Mixed as NFP Misses Estimates but Unemployment Rate and Hourly Earnings Improve
2023-07-07 12:54:38
Asia Day Ahead: Mixed Open in Asia; RBA minutes, China’s LPR in Focus
2023-06-20 02:00:00
Asia Day Ahead: Wall Street Up Overnight; Sentiment in Extreme-Greed Territory
2023-06-09 03:00:00
Swiss Franc Price Outlook: Banking Woes Support CHF Bid
2023-05-05 11:57:42
USD/CHF IG Client Sentiment: Our data shows traders are now at their most net-long USD/CHF since Jan 18 when USD/CHF traded near 0.92.
2023-04-12 14:23:00
Real Time News

Jul 18, 2023
Follow
🇺🇸 Net Long-term TIC Flows (May)
Actual: $25.8B
Expected: $110.2B
Previous: $127.8B
https://www.dailyfx.com/economic-calendar#2023-07-18
Jul 18, 2023
Follow
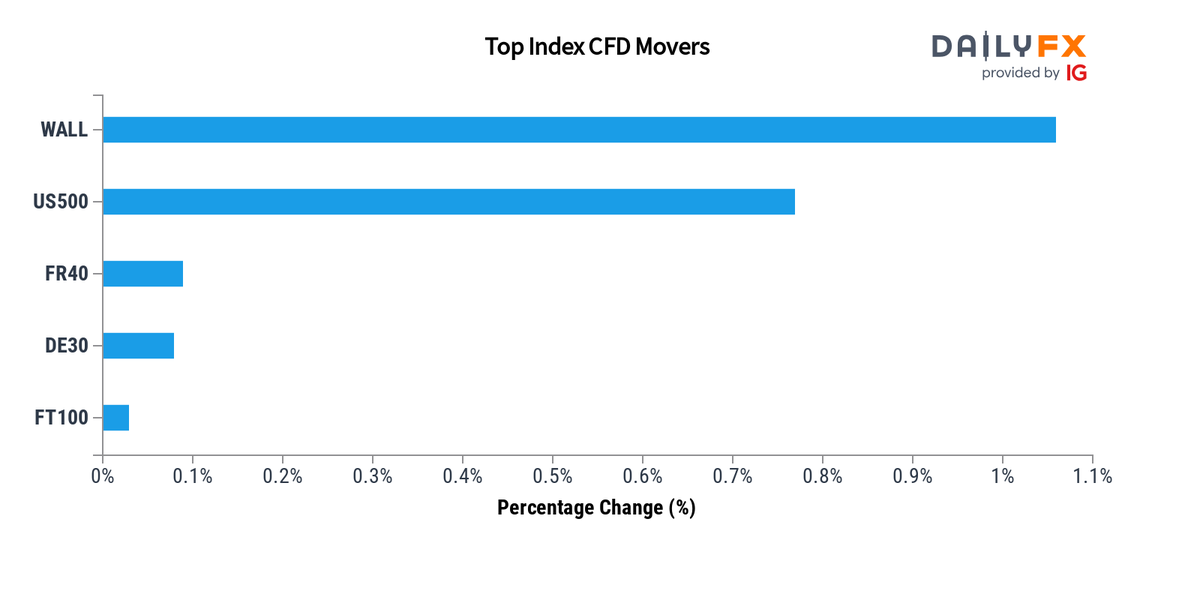
Indices Update: As of 20:00, these are your best and worst performers based on the London trading schedule:
Wall Street: 1.06%
US 500: 0.77%
France 40: 0.09%
Germany 40: 0.08%
FTSE 100: 0.03%
View the performance of all markets via https://www.dailyfx.com/forex-rates#indices https://t.co/ts7HI7zcYb
Jul 18, 2023
Follow
Heads Up:🇺🇸 Net Long-term TIC Flows (May) due at 20:00 GMT (15min)
Expected: $110.2B
Previous: $127.8B
https://www.dailyfx.com/economic-calendar#2023-07-18

Jul 24, 2023
Follow

Advertisement