
iShares 20+ Year Treasury Bond ETF (TLT) Stock Price
Treasury Bond ETF
| Low | |
| High |
Note: Low and High figures are for the trading day.
iShares 20+ Year Treasury Bond ETF (TLT) news, analysis and forecasts for expert trading insights. Get price data, news, charts and performance.
TLT is the ticker symbol for the iShares 20+ Year Treasury Bond ETF. The high-quality pooled investment vehicle seeks to track the performance of an index comprised of long-dated bonds issued by the U.S. Treasury with remaining maturities greater than or equal to twenty years. Each TLT share represents an ownership interest in the fund’s underlying portfolio and can be bought or sold like any other publicly traded security. Created in July 2002, managed by BlackRock and listed on Nasdaq, the TLT ETF offers investors a cost-effective and accessible way to diversify their holdings, reduce portfolio volatility, protect against market stress and risk-off episodes, or express a view on the outlook for long-term interest rates in one segment of the Treasury yield curve. Bond prices and interest rates move in opposite directions, so the TLT price will fall if interest rates increase or rise if interest rates fall.
View More
View Less
Advertisement


Real Time News

Jul 18, 2023
Follow
🇺🇸 Net Long-term TIC Flows (May)
Actual: $25.8B
Expected: $110.2B
Previous: $127.8B
https://www.dailyfx.com/economic-calendar#2023-07-18
Jul 18, 2023
Follow
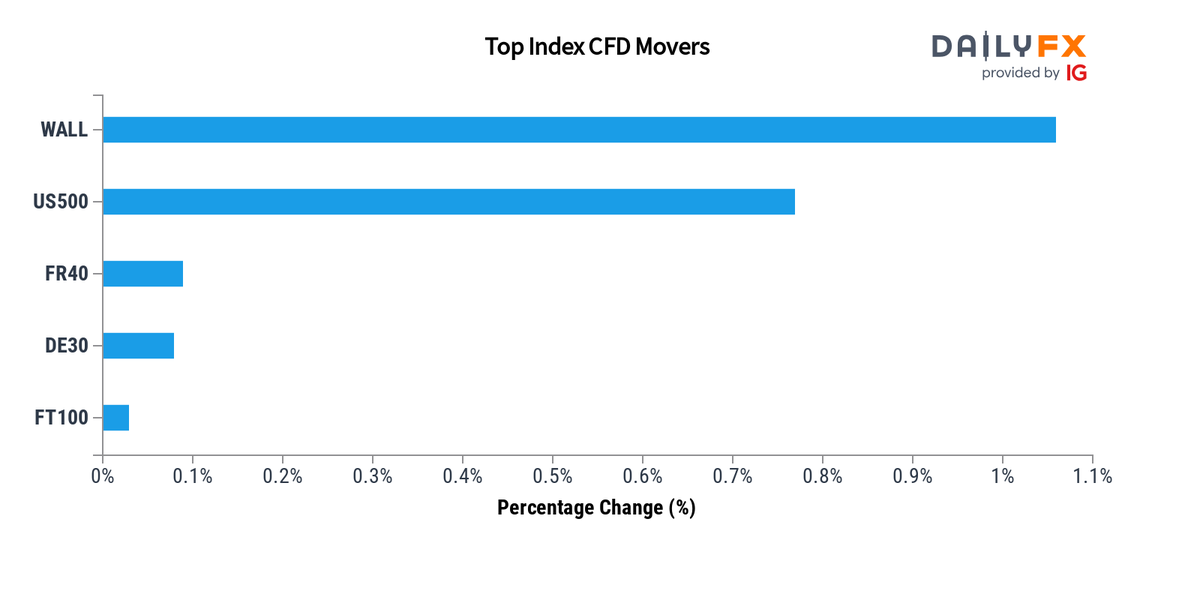
Indices Update: As of 20:00, these are your best and worst performers based on the London trading schedule:
Wall Street: 1.06%
US 500: 0.77%
France 40: 0.09%
Germany 40: 0.08%
FTSE 100: 0.03%
View the performance of all markets via https://www.dailyfx.com/forex-rates#indices https://t.co/ts7HI7zcYb
Jul 18, 2023
Follow
Heads Up:🇺🇸 Net Long-term TIC Flows (May) due at 20:00 GMT (15min)
Expected: $110.2B
Previous: $127.8B
https://www.dailyfx.com/economic-calendar#2023-07-18

Jul 24, 2023
Follow

Advertisement