


US Dollar Vs Euro, British Pound, Japanese Yen – Outlook:
- USD has fallen to a multi-month low against its peers.
- US jobs and CPI data have reinforced the market’s dovish pricing.
- What’s next for EUR/USD, GBP/USD, and USD/JPY?

The US dollar’s fall to new multi-month lows against its peers coupled with the break below key support levels is a sign of renewed bearishness in the greenback.
The outsized move in USD following the jobs report and CPI data suggest the market is convinced that the US Federal Reserve is near the end of its tightening cycle. Rate futures are pricing in a nearly 100% chance of one last 25-basis point hike at the July 25-26 meeting, with rate cuts starting in early 2024, according to the CME FedWatch tool. The market’s expectations contrast with the Fed’s projected two rate hikes before the year-end and no rate cuts until 2025.
Given that inflation continues to be well above the Fed’s target with the disinflation process slow at best, and the labour market remains resilient, a rate hike at the July meeting could yet go through. Beyond that, it remains highly uncertain, both in terms of whether rate hikes happen and by how much.
US Dollar Index (DXY) Daily Chart
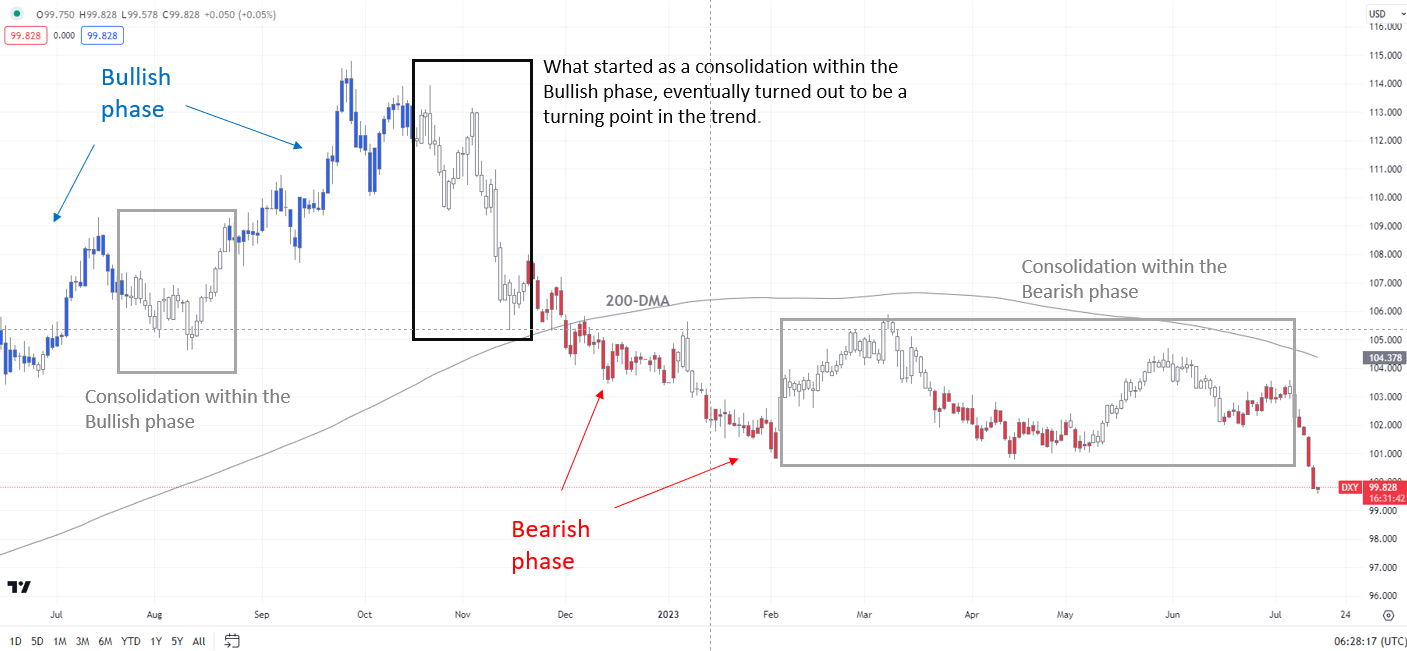
Chart Created by Manish Jaradi Using TradingView; Notes at the bottom of the page
From a relative monetary policy perspective, the general perception is that central banks outside the US continue to move on with further tightening, weighing on the US dollar. Moreover, hopes of more stimulus from China are likely to have a positive spillover on Asian economies from a flows perspective.
DXY Index Daily Chart

Chart Created by Manish Jaradi Using TradingView
On technical charts, the DXY index’s fall below an upward-sloping trendline, near the April low of 100.80 has triggered a bearish break from the triangle. As highlighted in the previous update, the triangle was a continuation pattern, and the probability of an eventual move lower remained high. See “US Dollar Week Ahead: USD Looks for Cues from PCE Data,” published June 24.
The break below key support has opened the way initially toward the 200-week moving average (at about 98.25), potentially toward 96.50.
EUR/USD Weekly Chart

Chart Created by Manish Jaradi Using TradingView
EUR/USD: Rises above the H1-2023 range
EUR/USD has risen to a 16-month high and above the H1-2023 range. The pair is now testing the upper edge of a rising channel from early 2023, roughly around the 200-week moving average. The rise to a multi-month high coupled with the 14-week Relative Strength Index consistently above 50 in H1 indicates that the medium-term trend remains up.
GBP/USD Weekly Chart

Chart Created by Manish Jaradi Using TradingView
GBPUSD: Powers through 200-WMA resistance
GBP/USD’s rise to a new 15-month high follows the triggering of a major reverse head & shoulders pattern – the left shoulder is at the July 2022 low, the head is at the September 2022 low, and the right shoulder is at the Q1-2023 low – pointing to a move toward 2021 high of 1.4250 in coming months.
USD/JPY Daily Chart
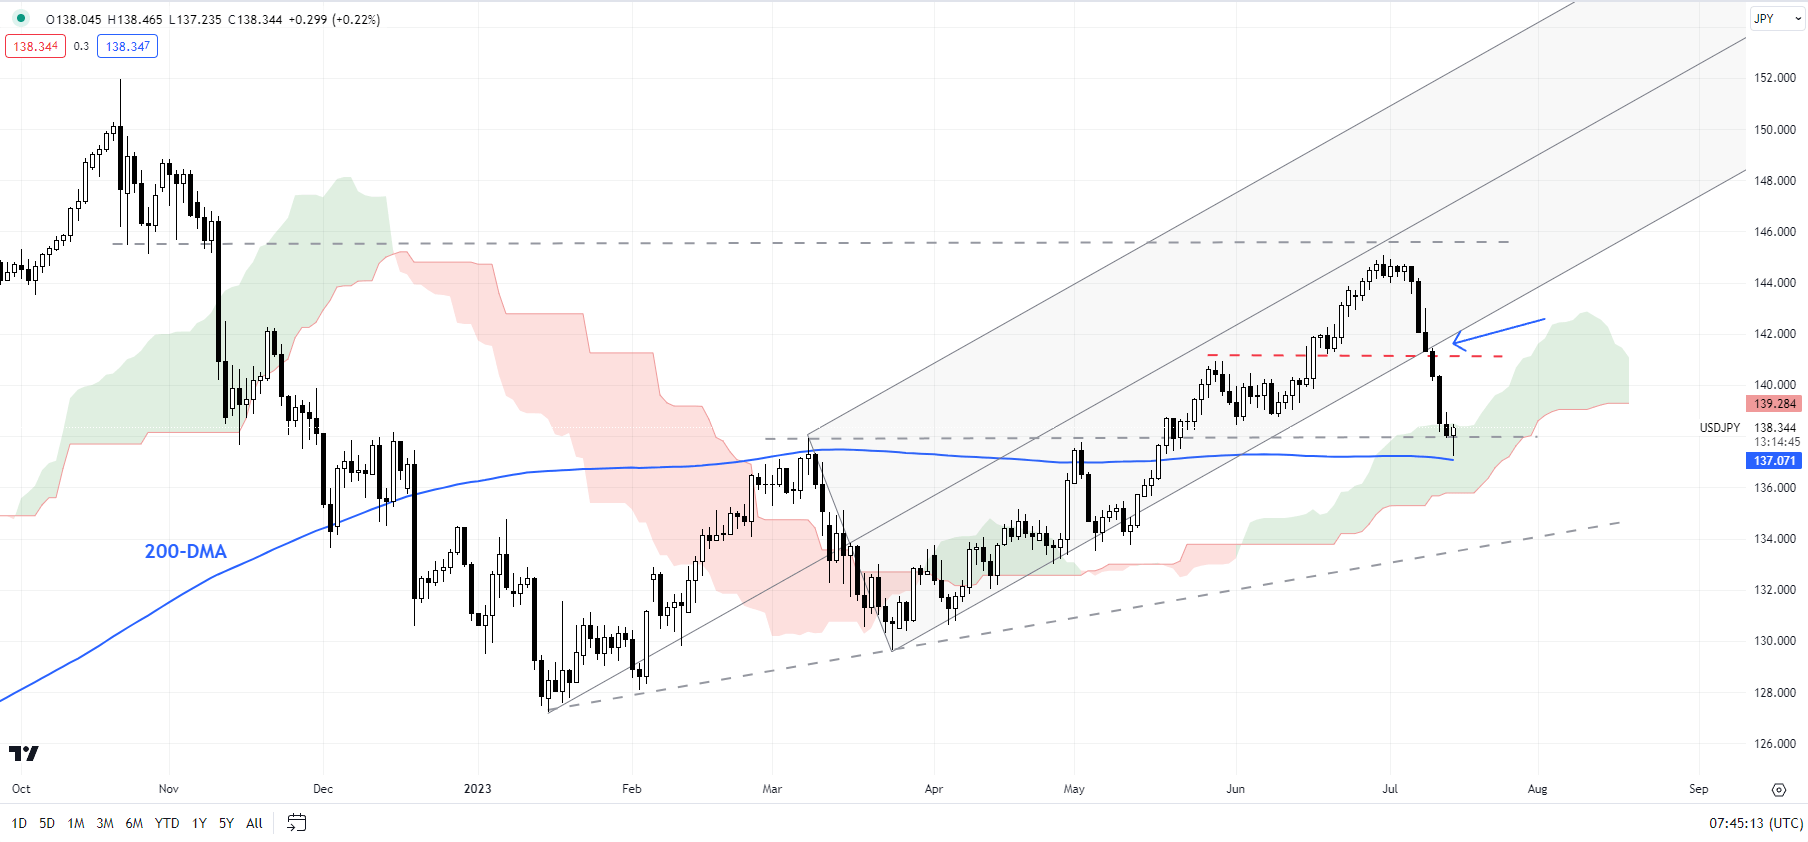
Chart Created by Manish Jaradi Using TradingView
USD/JPY: Cracks below support
USD/JPY’s uptrend has reversed following the break above key converged support, including the lower edge of a pitchfork channel from early 2023 and the May high. There is an immediate cushion at the March high of 137.90, pointing to a minor rebound. However, the upside could be capped, with growing odds of a drop below support.
Note: The above colour-coded chart(s) is(are) based on trending/momentum indicators to minimize subjective biases in trend identification. It is an attempt to segregate bullish Vs bearish phases, and consolidation within a trend Vs reversal of a trend. Blue candles represent a Bullish phase. Red candles represent a Bearish phase. Grey candles serve as Consolidation phases (within a Bullish or a Bearish phase), but sometimes they tend to form at the end of a trend. Candle colors are not predictive – they merely state what the current trend is. Indeed, the candle color can change in the next bar. False patterns can occur around the 200-period moving average, or around a support/resistance, and/or in a sideways/choppy market. The author does not guarantee the accuracy of the information. Past performance is not indicative of future performance. Users of the information do so at their own risk.

--- Written by Manish Jaradi, Strategist for DailyFX.com
--- Contact and follow Jaradi on Twitter: @JaradiManish


