
NZD/USD
NZD/USD
Bearish
Last updated:
Jul 24, 2023
| Low | |
| High |
of clients are net long.
of clients are net short.
Note: Low and High figures are for the trading day.
The NZD/USD pair shows the value of the New Zealand Dollar against the US Dollar; telling traders how many USD are needed to buy a NZD. The US Dollar is the most traded currency in the world while the NZD is consistently listed in the top ten, according to the Bank of International Settlements (2016). Get live updates on the NZD/USD rate with the chart and boost your fundamental and technical analysis with our expert NZD/USD forecast, news and analysis.
Advertisement
News & Analysis

New Zealand Dollar Soars as Inflation Beat Drives More RBNZ Tightening Bets
2023-07-18 23:00:00

US Dollar Finds Traction While China GDP Misses Estimates. Where to for USD?
2023-07-17 06:00:00

US Dollar Forecast: Sentiment Positive on AUD/USD, NZD/USD, Bearish on USD/CAD
2023-07-13 21:00:00
NZD/USD IG Client Sentiment: Our data shows traders are now at their least net-long NZD/USD since Dec 27 when NZD/USD traded near 0.63.
2023-07-13 15:23:38
US Dollar Slips While Japanese Yen Rallies Ahead of US CPI. New Lows for USD?
2023-07-12 05:00:00
All eyes on US CPI ahead, with mixed session in Asia: DJIA, USD/JPY, NZD/USD
2023-07-12 03:30:00
New Zealand Dollar Dipped Initially then Recovered After the RBNZ Left its Cash Rate Alone
2023-07-12 02:00:00
Real Time News

Jul 18, 2023
Follow
🇺🇸 Net Long-term TIC Flows (May)
Actual: $25.8B
Expected: $110.2B
Previous: $127.8B
https://www.dailyfx.com/economic-calendar#2023-07-18
Jul 18, 2023
Follow
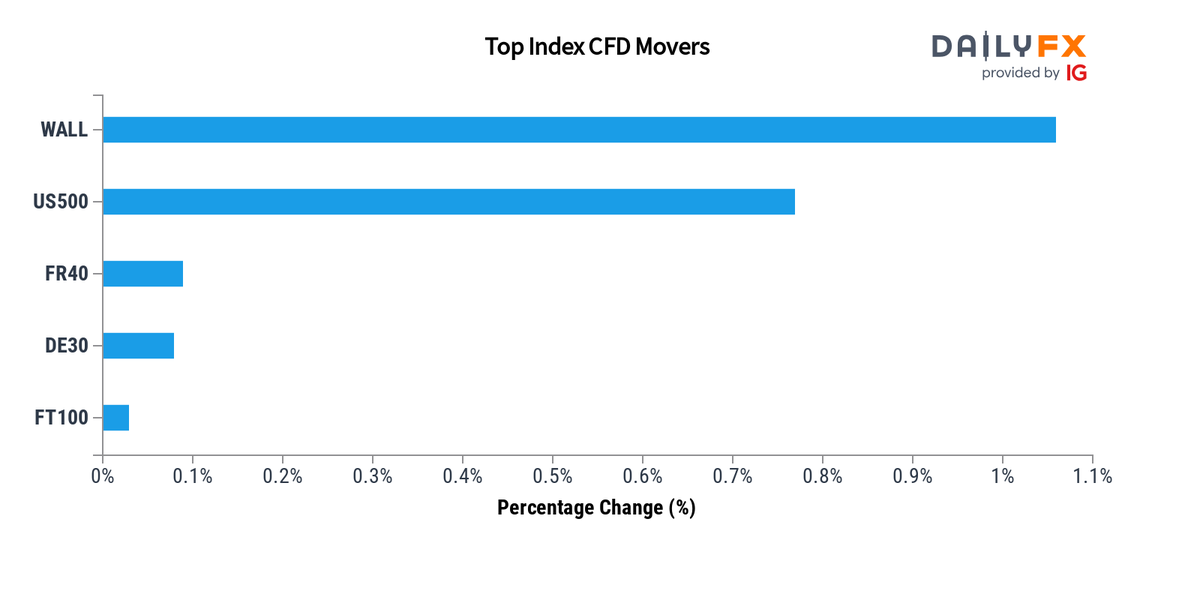
Indices Update: As of 20:00, these are your best and worst performers based on the London trading schedule:
Wall Street: 1.06%
US 500: 0.77%
France 40: 0.09%
Germany 40: 0.08%
FTSE 100: 0.03%
View the performance of all markets via https://www.dailyfx.com/forex-rates#indices https://t.co/ts7HI7zcYb
Jul 18, 2023
Follow
Heads Up:🇺🇸 Net Long-term TIC Flows (May) due at 20:00 GMT (15min)
Expected: $110.2B
Previous: $127.8B
https://www.dailyfx.com/economic-calendar#2023-07-18

Jul 24, 2023
Follow

IG Client Sentiment
NZD/USD
Bearish
Daily change in
Longs
0%
Shorts
-1%
OI
0%
Weekly change in
Longs
51%
Shorts
-45%
OI
-6%

Advertisement