
CRUDE OIL, WTI, NATURAL GAS, NG - Outlook:
- Natural gas prices could be due for further gains, according to EIA.
- Tentative signs that crude oil may have capitulated.
- What is the outlook on natural gas and crude oil, and what are the key levels to watch?

Natural gas: Base-building in progress?
Natural gas prices could be due for further gains on declining drilling activity on oversupply conditions, tighter credit conditions, and oversold technical conditions.
Reports suggest the US natural gas sector is rapidly pulling drilling rigs from the field due to oversupply conditions due to the collapse in natural gas prices in recent months. A drastic reduction in supply is likely to provide a floor to natural gas which is hovering around 2.5-year lows.
In its May Short-term Energy Outlook, the US Energy Information Administration expects the U.S. benchmark Henry Hub natural gas spot price to increase throughout 2023 from its recent lows. The agency expects the monthly average price to reach 3.71 in December on increased demand and reduced production.
Natural Gas Daily Chart
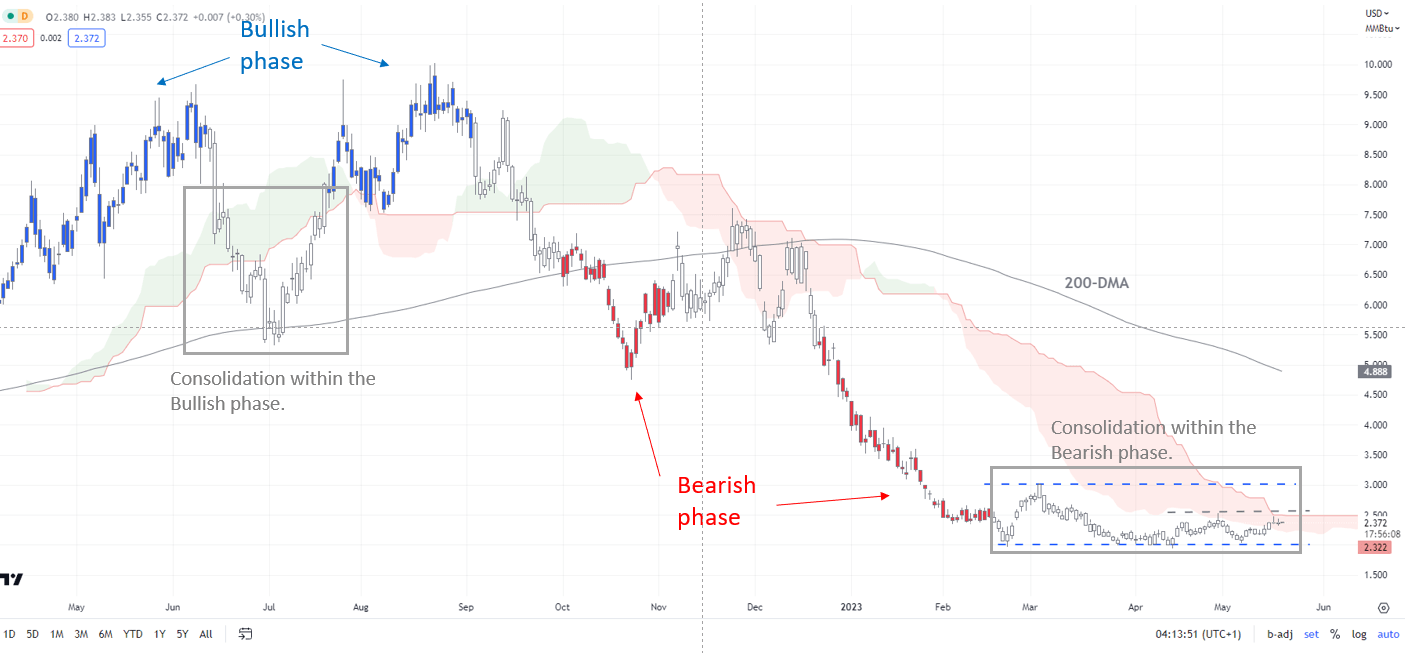
Chart Created by Manish Jaradi Using TradingView; Notes at the bottom of the page.
On technical charts, the bearish pressure appears to be fading as natural gas has shifted to a consolidation phase (see colour-coded candlestick charts based on trending/momentum indicators). Moreover, market diversity had been running at extremely low levels. See “Natural Gas Price Setup: Downward Pressure is Abating”, published April 11.
Natural Gas Weekly Chart
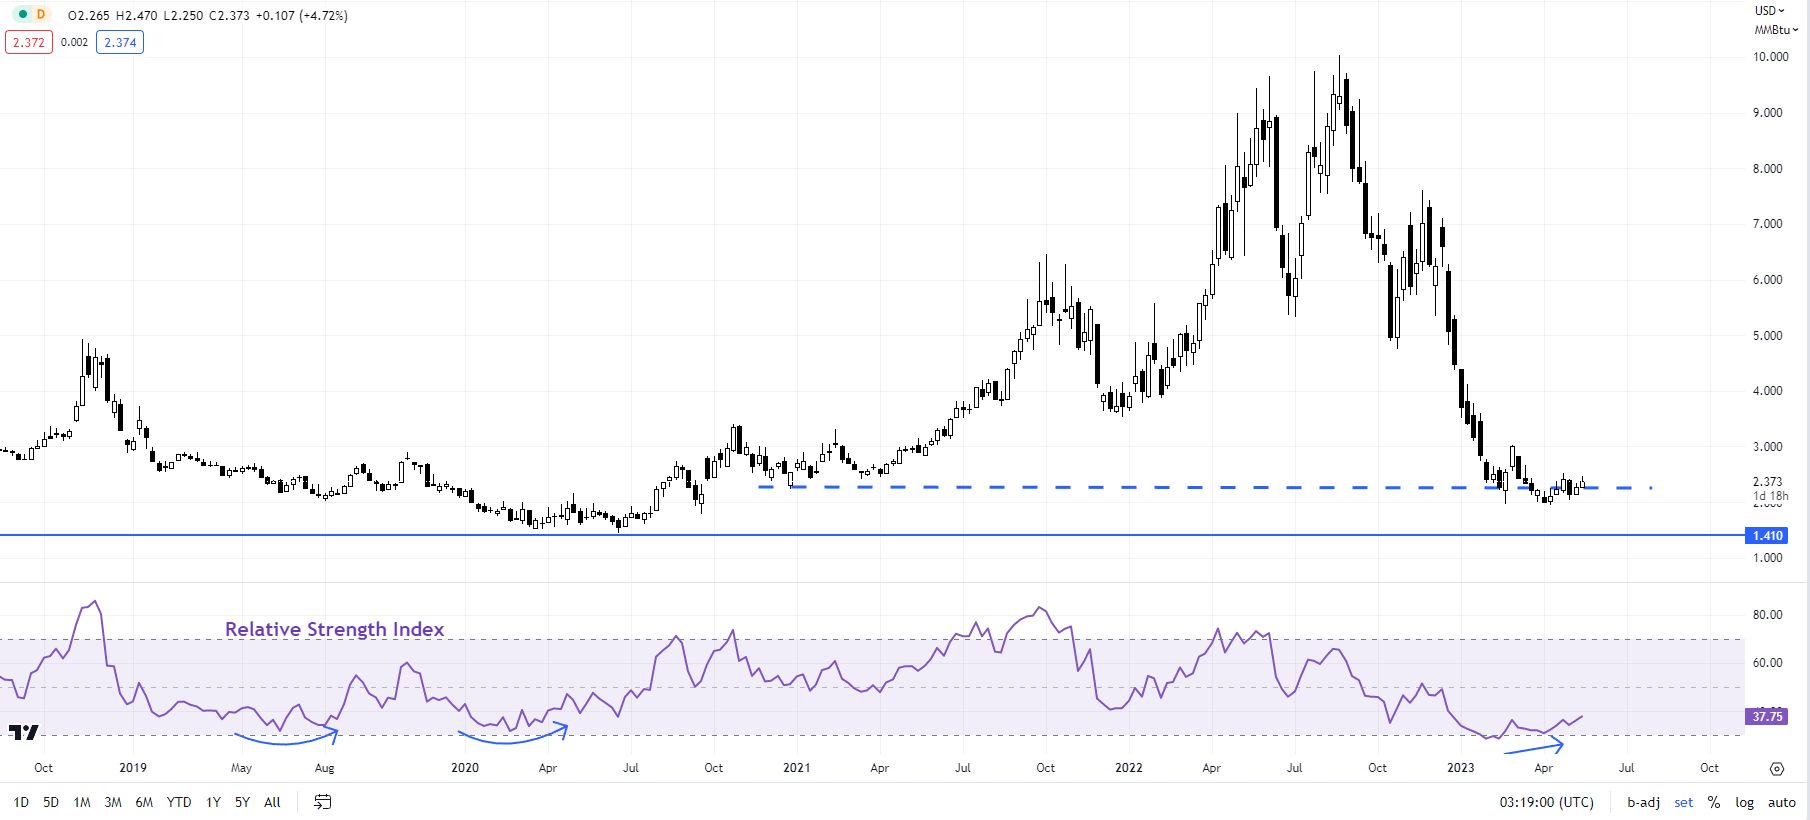
Chart Created by Manish Jaradi Using TradingView
It is now testing a vital ceiling at the April high of 2.52. A break above is needed to confirm that the downward pressure has eased. Such a break could open the door toward the March high of 3.03. Natural gas appears to have found some support at the February low of 1.97. Positive momentum divergence on the daily and weekly charts (declining price associated with higher momentum readings) indicates that the multi-month-long slide is losing momentum.
Crude Oil Daily Chart
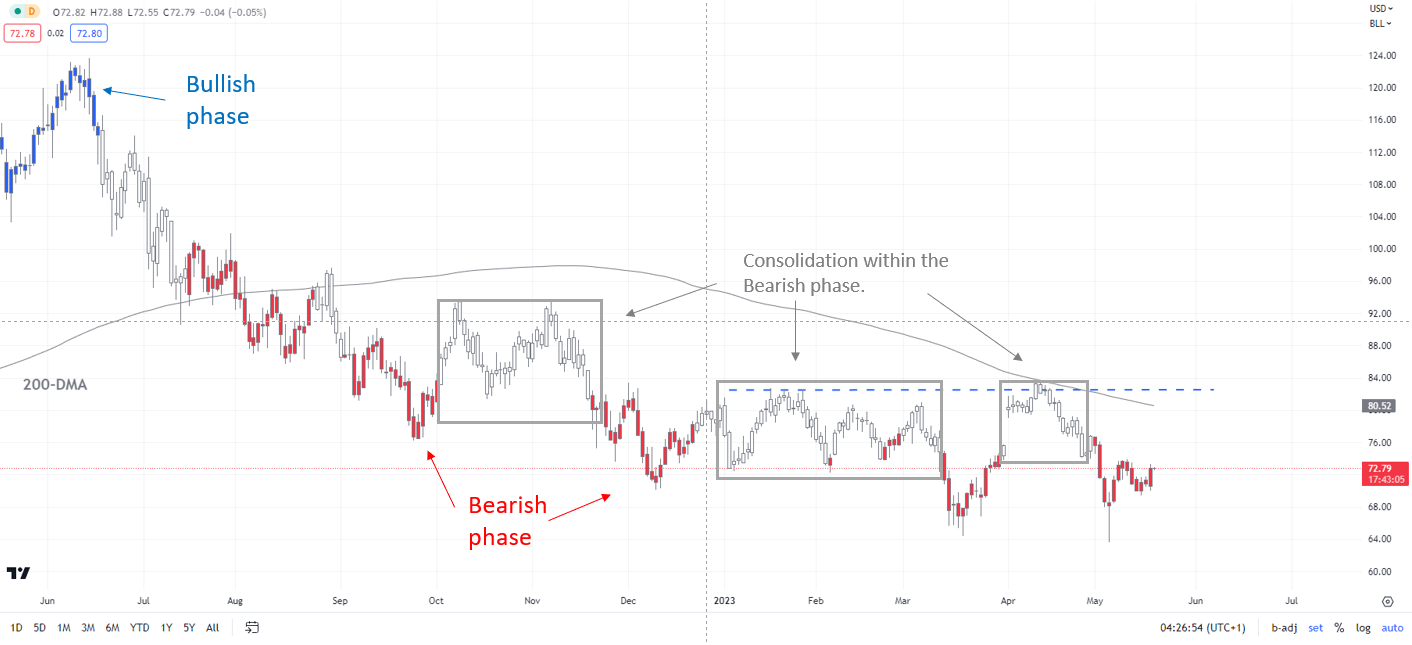
Chart Created by Manish Jaradi Using TradingView; Notes at the bottom of the page.
Crude Oil: Holding above key support
Meanwhile, upward momentum has been lacking even as crude oil has seemingly found a floor for now. While the downtrend hasn’t reversed yet, the recent price action raises the odds that oil may have capitulated. For more discussion, see “Crude Oil Extends Slide in Asia: Is This Capitulation?”, published May 4.
Crude Oil Weekly Chart

Chart Created by Manish Jaradi Using TradingView
To be fair, the broader trend remains down since mid-2022 as the colour-coded candlestick charts based on trending/momentum indicators show. See recent updates (April 10,April 13, andApril 26) highlighting the consolidation phase despite the output cut by OPEC and its allies in April.
An encouraging sign for bulls is holding above major converged support: the 200-week moving average and the March low. But unless the 82.00-84.00 resistance is broken, the path of least resistance for oil is sideways to down.
Note: In the above colour-coded chart, Blue candles represent a Bullish phase. Red candles represent a Bearish phase. Grey candles serve as Consolidation phases (within a Bullish or a Bearish phase), but sometimes they tend to form at the end of a trend. Note: Candle colors are not predictive – they merely state what the current trend is. Indeed, the candle color can change in the next bar. False patterns can occur around the 200-period moving average, or around a support/resistance and/or in sideways/choppy market. The author does not guarantee the accuracy of the information. Past performance is not indicative of future performance. Users of the information do so at their own risk.
Trade Smarter - Sign up for the DailyFX Newsletter
Receive timely and compelling market commentary from the DailyFX team
--- Written by Manish Jaradi, Strategist for DailyFX.com
--- Contact and follow Jaradi on Twitter: @JaradiManish