


Gold managed to pull itself out of a situation that many traders would have considered a critical technical breakdown just at the beginning for the fourth quarter. There was some technical precedence around the 1,615 level that the commodity held after clearing the 1,680-support carved out through a two-and-a-half-year range. However, the simultaneous drop from the US Dollar – the metal’s principal pricing instrument – around the same time probably played a far greater role in the market’s regaining balance. In fact, it could be argued that the Greenback’s initial rally was what forced the failed breakdown in the first place (you don’t see the same progress from gold priced in Euros, Pounds or Yen). Setting aside the debate around the merits of the failed break lower, there remains an extended consolidation from the precious metal. Ranges are ‘paths of least resistance’, but there will be some strong fundamental winds to contend with in 2023 with distinct correlations to be found in the charts. The swell in interest rates is a particularly strong influence given gold plays an alternative to troubled traditional fiat…and higher rates tend to highlight gold’s lack of yield.
Gold (XAU/USD) Monthly Chart Overlaid with Major Central Bank Benchmark Rates
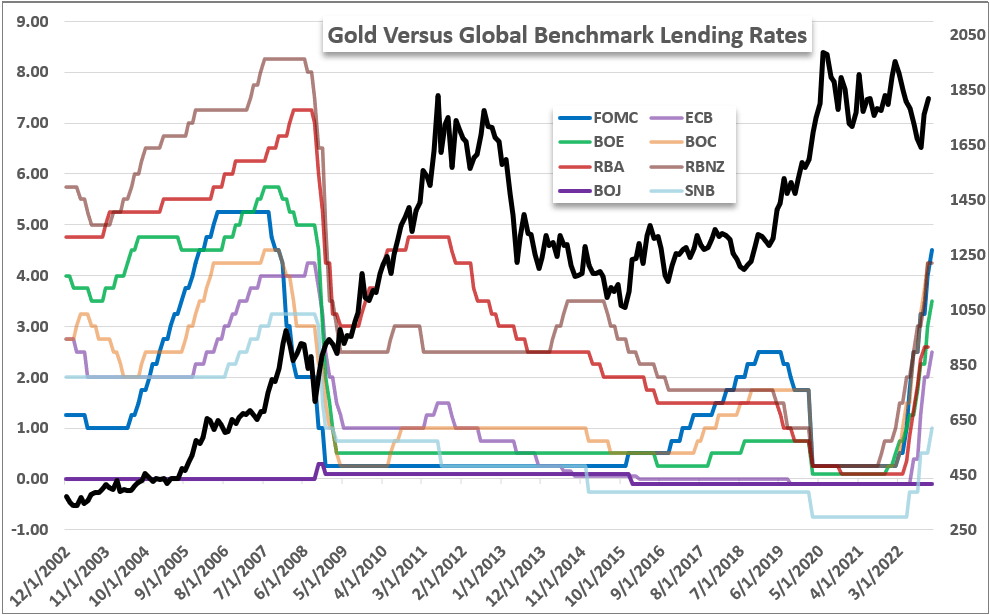
Source: John Kicklighter
Taking out the overlays, the technical guidelines for this market on the shorter-term (daily) present clear mile markers both higher and below. The midpoint to the extremes of the post-pandemic ranges from gold at 1,845 is an important baseline for progress. Moving higher than that will draw on levels that are less clearly defined and based more on the chop of consolidation channels of previous quarters. There are zones of congestion between 1,880 to 1,920 and to 2,000 above. Trading in this vicinity could quickly turn to chop. To the downside, the 100-day simple moving average (SMA) will be a closely observed measure for general intent, but it remains to be seen whether the former range low at 1,680 will retain any technical weight. Notably, the midpoint of the 2018 to 2020 bull wave to record highs stands around 1,615 – the approximate 2022 lows.
Gold (XAU/USD) Daily Chart with Volume and 100-Day Simple Moving Average
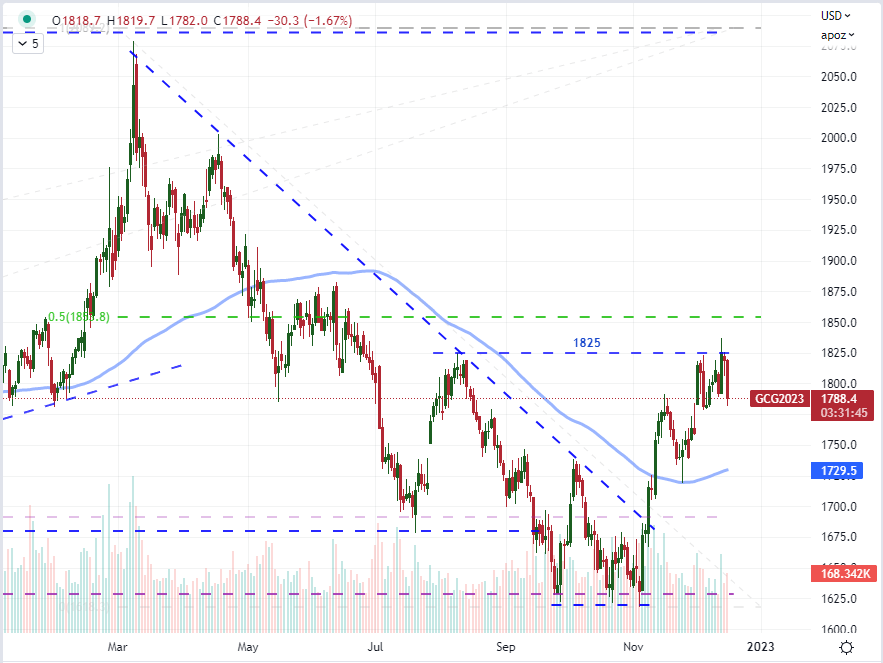
Source: TradingView.com, Prepared by: John Kicklighter
Turning the dial on the periodicity up a notch to the weekly chart, it is important to appreciate that we are closing out the year fairly close to the $450 range we’ve been describing. Therefore, sans a strong trend, it could take the markets considerable time to reach the outer bands of the congestion pattern. And after doing so, we would then need to muster the strength required for a definitive break. The 12-week (equivalent to three-month) average true range (ATR) from gold was 1.5 percent. It would take six weeks of productive trend at that pace to reach the barrier from the middle of the range. Half a quarter of normal activity levels just to reach the border. Of course, it is more than possible to see points of acceleration through the opening quarter of 2023. And, unless there is an incredible swell in bullish interest, we will be sporting a lower high / lower low dominant pattern tipping the scales in favor of the bears.
Gold (XAU/USD) Weekly Chart with Volume, 100-Day SMA and COT Net Speculative Futures Positioning
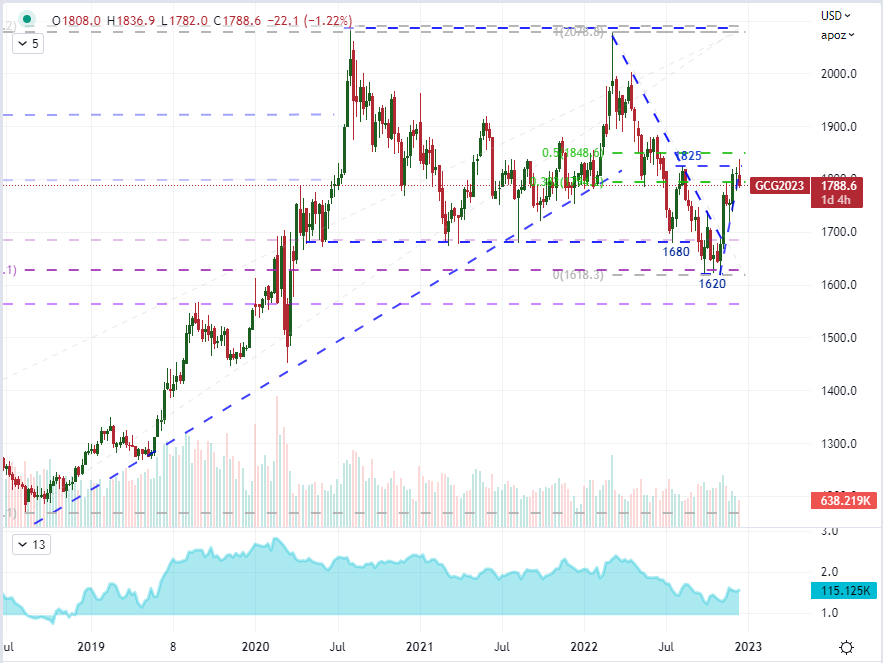
Source: TradingView.com, Prepared by: John Kicklighter
Turning the dial all the way up to a monthly tenor to look at the scope of activity for potentially years into the future, this extended bout of congestion looks fairly similar to the congestion that developed between 2011 and 2013. Setting aside the prominent difference that the previous range floor’s clearance led to a dramatic leg down rather than the recent false break, the general axiom of trend, consolidation and eventual turn are a little more straightforward. It is also worth pointing out that 7 consecutive month slide through October (matching the longest stretch lower since 1964) can draw comparison to the general bottoming of 2018 (after a 6-month slide) or present the first leg down with brief respite like 2013 (after a 5-month move).
Gold (XAU/USD) Monthly Chart with Volume, 100-Day SMA and COT Net Speculative
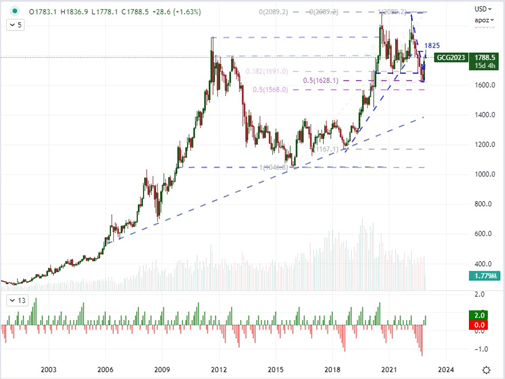
Source: TradingView.com, Prepared by: John Kicklighter