


Weekly Technical Trade Levels on USD Majors, Commodities & Stocks
- Technical setups we’re tracking into the weekly open
- Key levels for the US Dollar Majors, Gold, Crude Oil, S&P 500 and more!
- New to Gold Trading? Get started with this Free How to Trade Gold -Beginners Guide
In my last Strategy Webinar we discussed the threat for downside exhaustion in stocks as the major indices approached key support zones. The levels are clear heading into the weekly open with numerous monthly opening-ranges intact near trend extremes across the USD majors. The technical picture is a bit precarious here as momentum tails-off but remain poised for possible breakouts in the days ahead. The focus shifts to continued updates on the global inflation picture with data out of the UK, the Eurozone and Canada on tap mid-week.
In this webinar we take an in-depth look at the technical trade levels for US Dollar (DXY), Euro (EUR/USD), British Pound (GBP/USD), Canadian Dollar (USD/CAD), Australian Dollar (AUD/USD), Gold (XAU/USD), Crude Oil (WTI), S&P 500 (SPX500), Nasdaq (NDX), Dow Jones Industrial Average (DJI), and Bitcoin.
You can always find the latest Strategy Webinar on my YouTube playlist.
British Pound Price Chart - GBP/USD Daily
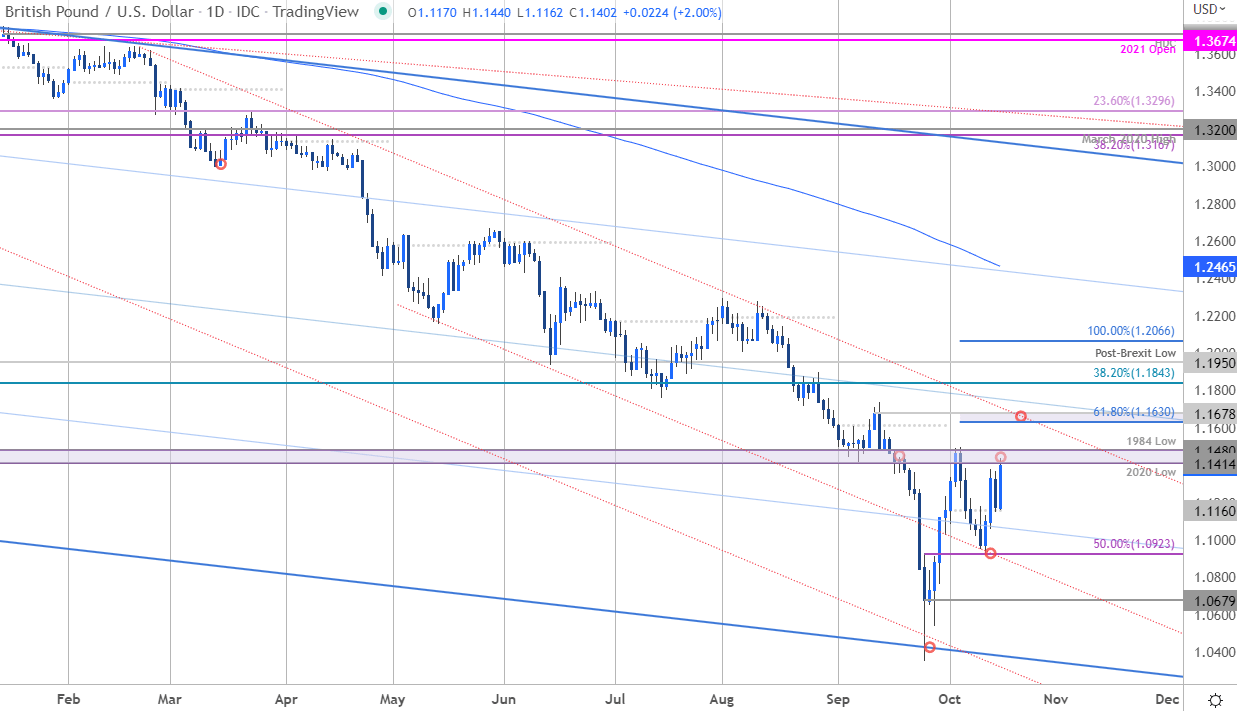
Chart Prepared by Michael Boutros, Technical Strategist; GBP/USD on Tradingview
Sterling is back at a key pivot I’ve been highlighting for months now around the 2020 / 1984 lows at 1.1414/80 with the monthly opening-range set just below - looking for possible price inflection up here. Broader bearish invalidation eyed at 1.1630/78. Support at the October open / low-week close at 1.1160 with a close below 1.0923 needed to mark resumption. Review my latest British Pound Weekly Technical Forecast for closer look at the longer-term GBP/USD trade levels.
S&P 500 Price Chart – SPX500 240min Chart
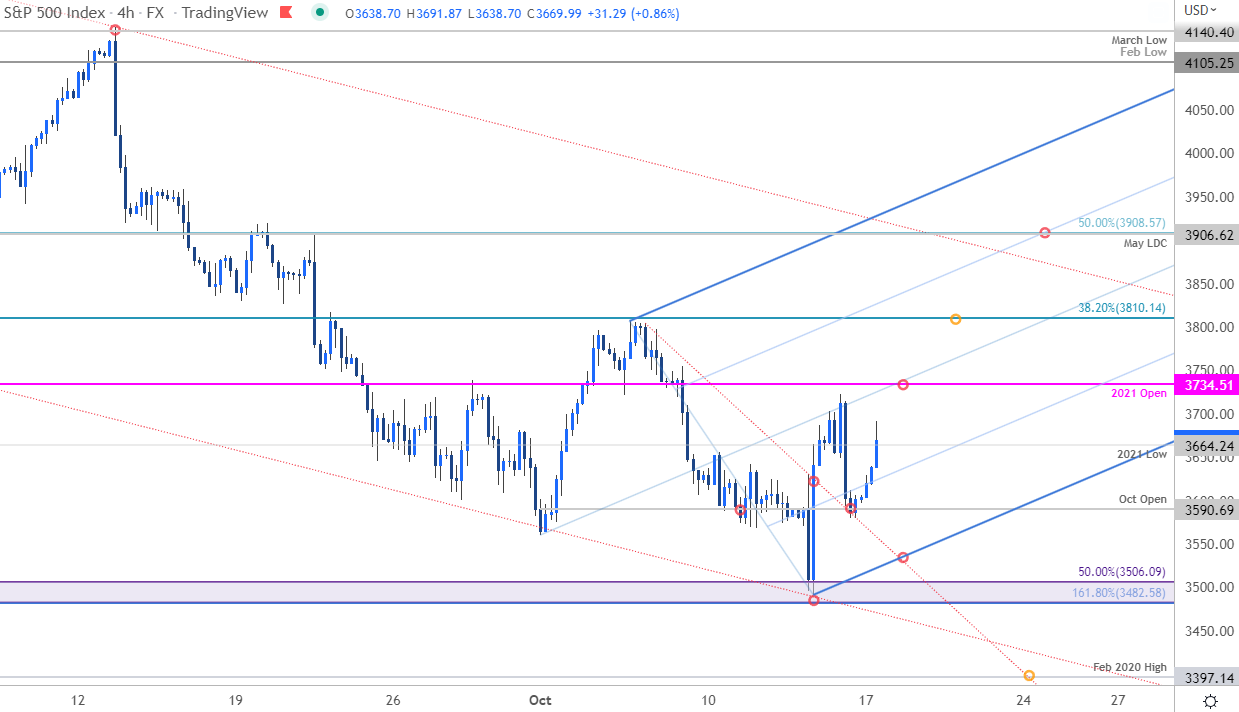
Chart Prepared by Michael Boutros, Technical Strategist; SPX500 on Tradingview
The S&P 500 held support on Friday and a well-defined monthly opening-range remains intact just above critical support at 3482-3506 – on the lookout for a breakout in the days ahead with. Risk remains for a near-term recovery within the broader downtrend – initial resistance 3434 and 3810. Review my latest SPX500 Short-term Technical Outlook.
Canadian Dollar Price Chart – USD/CAD Weekly
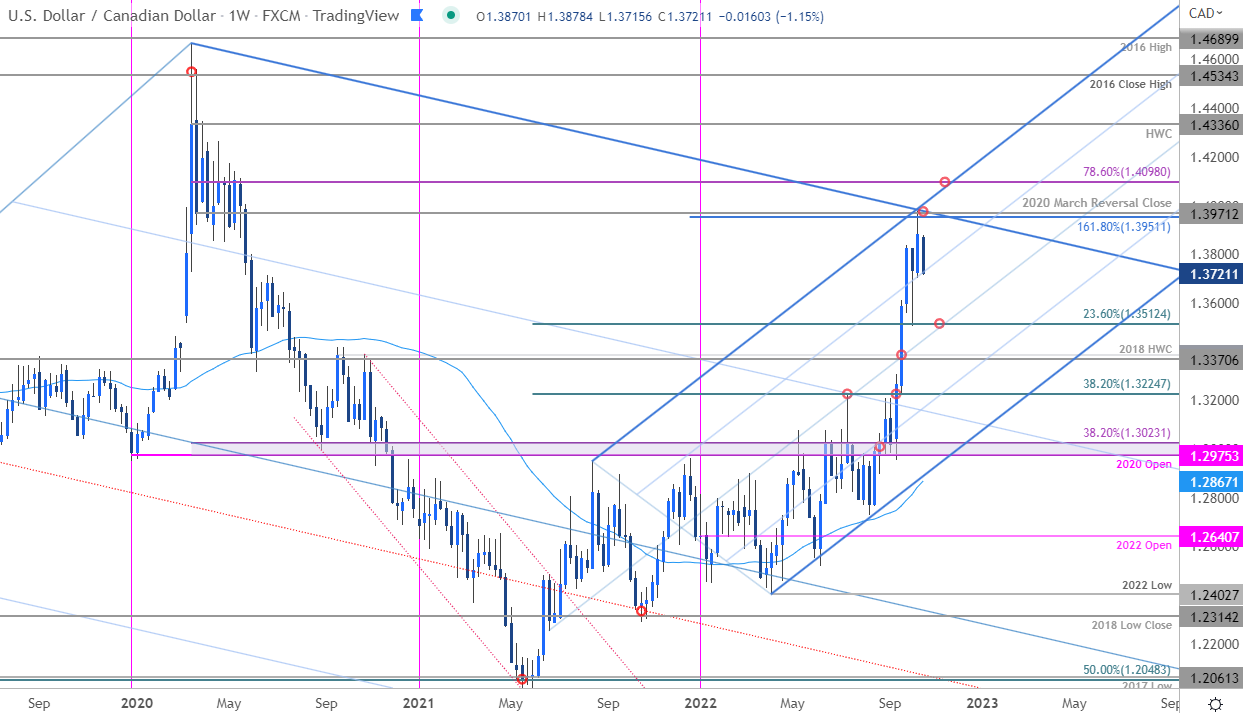
Chart Prepared by Michael Boutros, Technical Strategist; USD/CAD on Tradingview
In last week’s Canadian Dollar Weekly Technical Forecast I highlighted a key resistance zone in USD/CAD at 1.3951/71- a region defined by the 1.618 Fibonacci extension of the 2021 advance and the 2020 March weekly reversal close. The registered high at 1.3977 remains intact with the US Dollar plunging more than 1.8% off that mark. Risk remains for a deeper correction here IF price breaks below this upslope with initial weekly support eyed at 1.3512.
For a complete breakdown of Michael’s trading strategy, review his Foundations of Technical Analysis series on Building a Trading Strategy
Economic Calendar
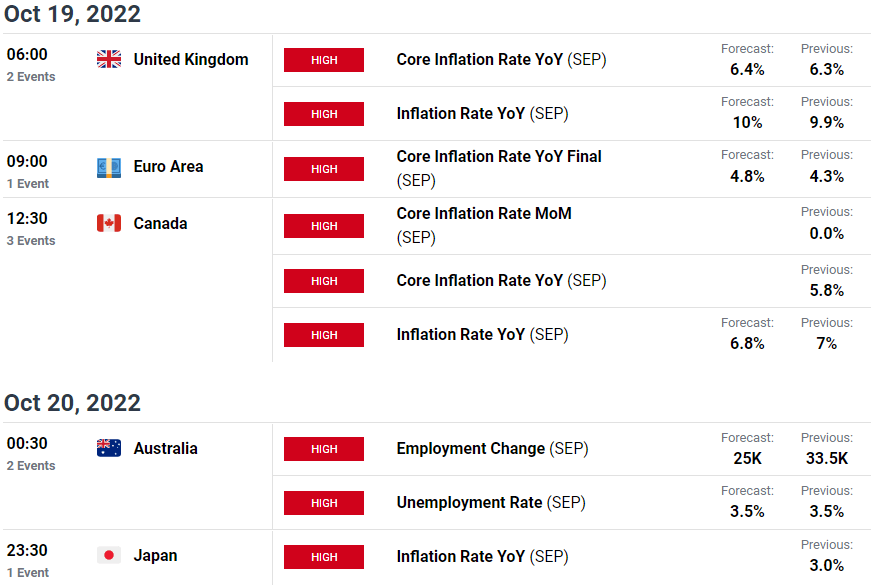
Economic Calendar - latest economic development and upcoming event risk
Foundational Trading Knowledge
Forex for Beginners
New to Forex Trading? Get started with this Beginners Guide
---Written by Michael Boutros, Technical Strategist with DailyFX
Follow Michael on Twitter @MBForex


