

RAND TALKING POINTS & ANALYSIS
- SARB likely to pause.
- US retail sales data keeps rand on the front foot.
- 200-day MA under the spotlight.
Trade Smarter - Sign up for the DailyFX Newsletter
Receive timely and compelling market commentary from the DailyFX team
USD/ZAR FUNDAMENTAL BACKDROP
The rand is in for a volatile week with South African CPI and the South African Reserve Bank (SARB) interest rate decisions due. USD/ZAR has been on a downward trajectory over the last few weeks but has since stalled as incoming economic data comes into focus. US retail sales data (see economic calendar below) missed estimates further exacerbating fears around a US slowdown.
USD/ZAR ECONOMIC CALENDAR (GMT +02:00)
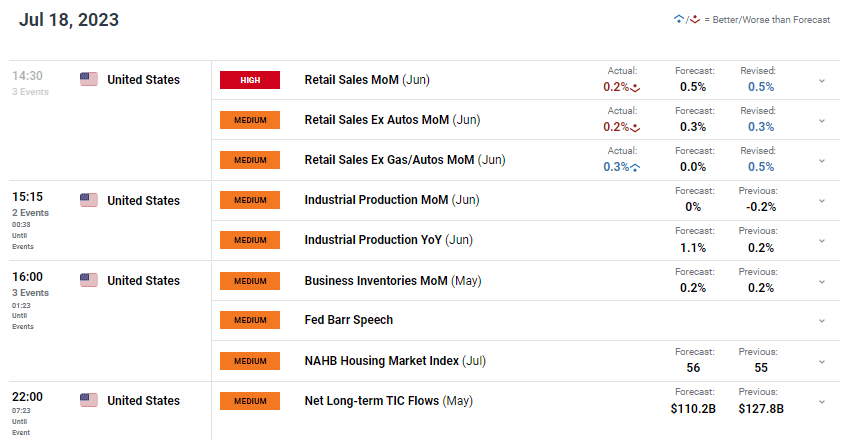
Source: DailyFX Economic Calendar
Looking ahead, the SARB rate decision is most likely to result in a rate pause following many major central banks including the Federal Reserve as inflationary pressures are showing signs of decline. On a negative note, Chinese growth concerns have extended this week with GDP numbers hindering commodity price upside. That being said, markets have largely priced this in and any Chinese optimism could bolster ZAR gains.
Foundational Trading Knowledge
Commodities Trading
Recommended by Warren Venketas
TECHNICAL ANALYSIS
USD/ZAR DAILY CHART
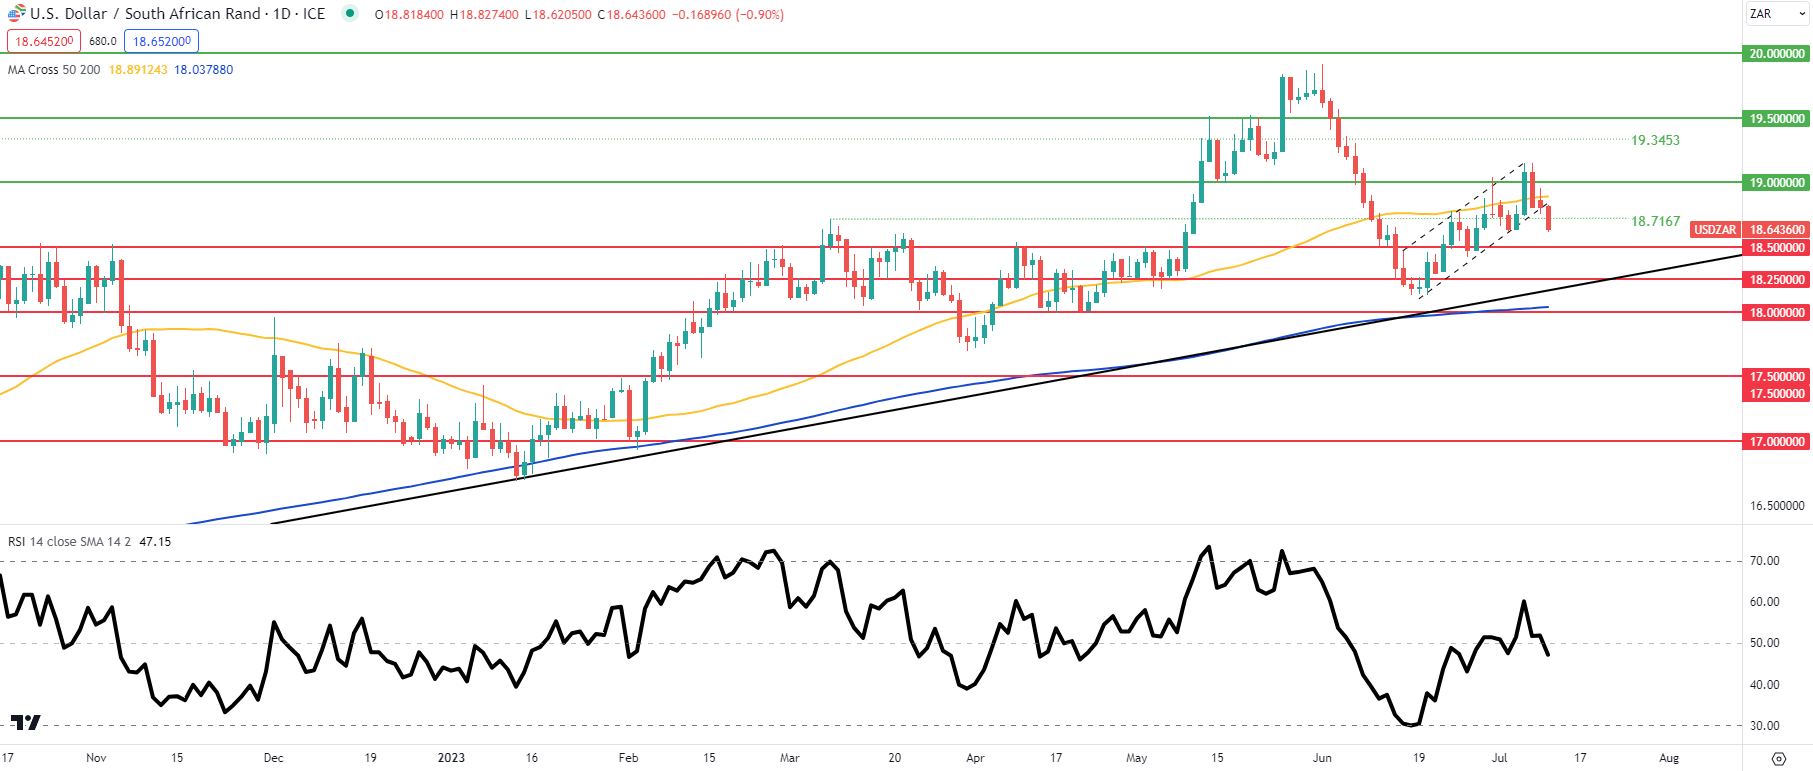
Chart prepared by Warren Venketas, IG
Daily USD/ZAR price action above trades at a key area of confluence around the 200-day moving average (blue) and the 18.0000 psychological handle. Although there is bullish divergence unfolding between USD/ZAR prices and the Relative Strength Index (RSI) oscillator, there is still room for further downside to come. Considering inflation is projected to decline alongside a rate pause, a slowdown in recent rand gains may subside short-term. Should the pair end the week below 18.0000, this could be seen as a bearish signal, exposing subsequent support zones thereafter.
Resistance levels:
- 18.2500
- 18.0000/20-day moving average (blue)
Support levels:
- 17.7000
- 18.5000
Contact and followWarrenon Twitter:@WVenketas