
USD/JPY FORECAST:
- The Japanese yen weakened dramatically against the U.S. dollar in June, but has begun to recover in recent days
- The U.S. dollar's technical and fundamental outlook, however, remains constructive
- This article looks at one potential bullish trading setup in USD/JPY

Most Read: Japanese Yen Aided by Jump in Japan Wages: USD/JPY, EUR/JPY, AUD/JPY Price Setups
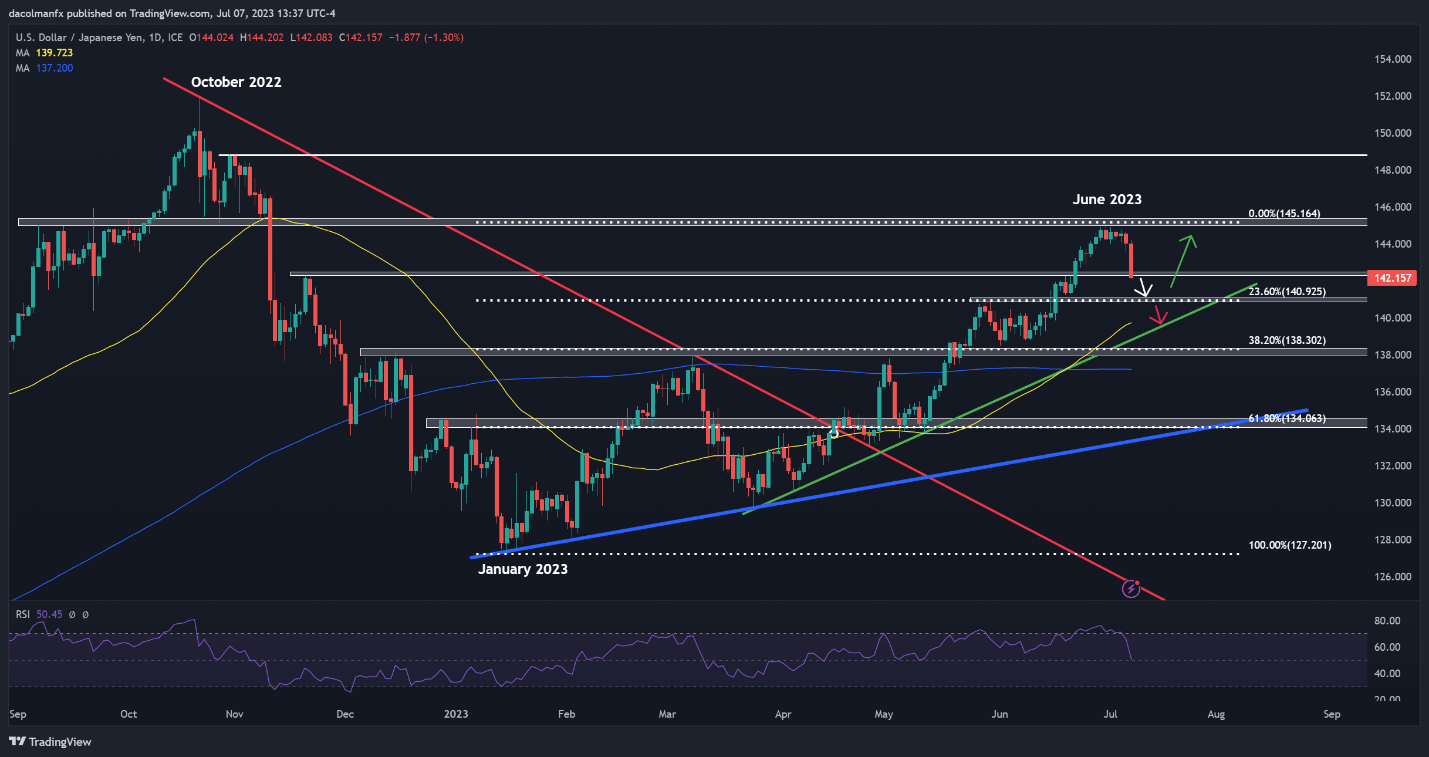
After rallying more than 3.5% in June to multi-month highs above the psychological 145.00 mark, the U.S. dollar has softened against the Japanese yen over the past few days, with the exchange rate down around 1.5% in the first week of July. This slump, however, may be part of a temporary correction, as the fundamental and technical outlook for the greenback remains constructive.
When an asset becomes overbought and its price rises too quickly, as has happened recently with USD/JPY, it is normal for pullbacks to occur, as traders who have taken long positions and have been partly responsible for the upward move begin to take profits. This may be taking place right now, meaning there is no reason to believe that a new trend is developing.
With USD/JPY still firmly biased to the upside, weakness could fade soon. The daily chart shows that after Friday's sell-off, prices are approaching an important support zone near 140.92, corresponding to the 23.6% Fibonacci retracement of the January 2023/June 2023 advance. The pair could establish a base around these levels before turning higher and resuming its ascent.

To take advantage of this theory, one trading idea to consider is to wait for the pair to pull back a bit further and position for a bounce off the 140.92 floor. As stated previously, USD/JPY could bottom out here prior to initiating the next leg higher, which could potentially lead to a retest of the June high in a matter of days or perhaps weeks.
On the other hand, if USD/JPY extends its decline but fails to respect Fibonacci support, subsequently breaking below 140.92, the bullish tactical setup would be invalidated. Such a breakdown could damage the technical picture, attracting new sellers into the market and creating the right conditions for a drop towards a short-term rising trendline cruising slightly above the 139.00 handle.
| Change in | Longs | Shorts | OI |
| Daily | -28% | 10% | -7% |
| Weekly | -28% | 21% | -2% |
USD/JPY TECHNICAL CHART