U.S. DOLLAR ANALYSIS & TALKING POINTS
- ISM services PMI beat has dollar bulls licking their lips.
- More Fed rate hikes being priced in.
- Bulls test key area of confluence ahead of tomorrow’s NFP’s.

DOLLAR FUNDAMENTAL BACKDROP
US ISM services PMI numbers (see economic calendar below) reached their highest level since February this year reflecting a resilient US economy – considering the US is primarily services driven. The non-manufacturing sector remains in expansionary territory with business activity, new orders and employment all growing. The tight labor market was reiterated through the ADP employment change release earlier that almost doubled estimates coming in at 497K. Using this as a precursor to tomorrow’s Non-Farm Payroll (NFP), the current hawkish bias from the Fed may be supplemented.
Trade Smarter - Sign up for the DailyFX Newsletter
Receive timely and compelling market commentary from the DailyFX team
US ECONOMIC CALENDAR
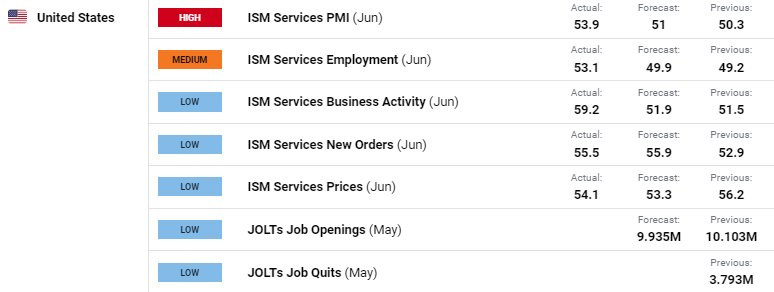
Source: DailyFX economic calendar
JOLTs contrasted ADP numbers but were largely dismissed by markets as money market pricing (refer to table below) of the Fed’s upcoming rate decisions have been increased to roughly 36bps by November from 28bps earlier this morning.
FEDERAL RESERVE INTEREST RATE PROBABILITIES
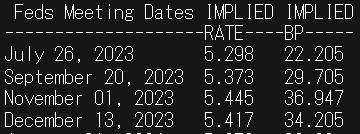
Source: Refinitiv
MARKET REACTION - TECHNICAL ANALYSIS
U.S. DOLLAR INDEX DAILY CHART
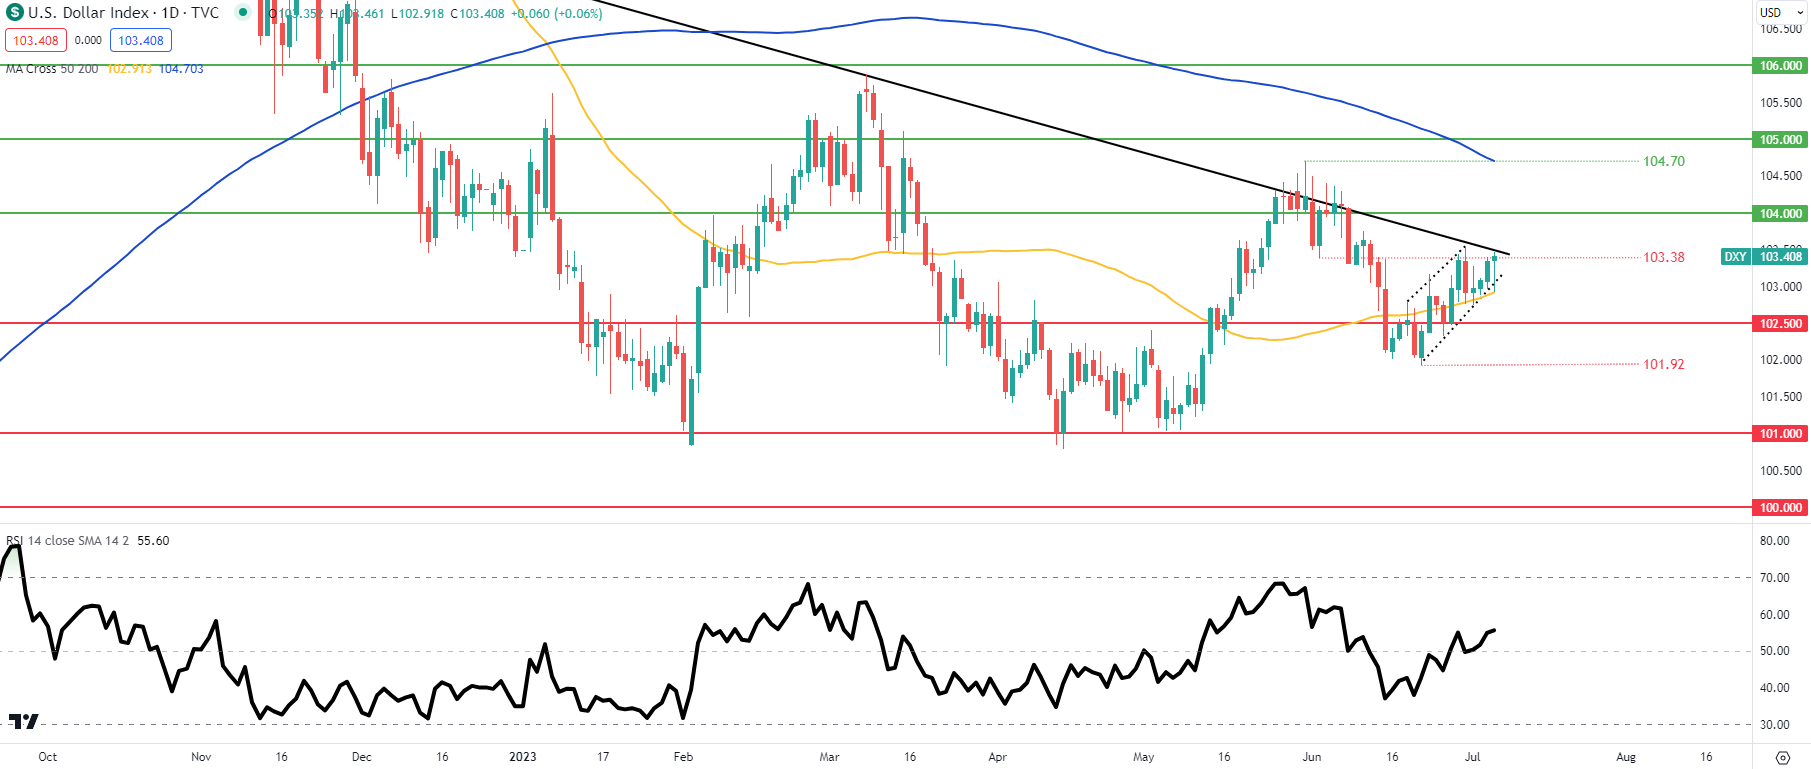
Chart prepared by Warren Venketas, IG
The daily Dollar Index (DXY) chart naturally pushed higher now above the 103.38 level and looking to re-test the longer -term trendline resistance zone (black). A long lower wick has since been formed on today’s daily candle and a close above trendline resistance could see bulls favor more upside.
From a bearish perspective, another trendline rejection and move below channel support (dashed black line) could open up subsequent support zones.
Resistance levels:
- 104.00
- Trendline resistance
Support levels:
- Channel support
- 50-day moving average (yellow)
- 102.50
--- Written byWarren Venketasfor DailyFX.com
Contact and followWarrenon Twitter:@WVenketas