Euro Vs US Dollar, Japanese Yen, Australian Dollar – Outlook:
- EUR/USD’s trend remains up as it hits a multi-month high.
- EUR/JPY has rebounded from key support, while EUR/AUD is testing key resistance.
- What is the outlook and the key levels to watch in key Euro crosses?

The euro is testing the top end of the recent range against the US dollar ahead of the key Euro area inflation data later Wednesday and next week’s crucial central bank meetings.
Euro area core CPI is forecast to have risen 5.4% on-year in June Vs 5.3% in May. Headline CPI is expected to have moderated to 5.5% on-year from 6.1% previously, but still up 0.3% on-month Vs being flat in May. While a stronger-than-expected CPI print could seal a rate hike by ECB next week, on its own the inflation data may not be sufficient to push EUR decisively higher.
Money markets price in around a 95% chance of a 25-basis point ECB hike next week, and around a 70% chance of a further rate rise in September. However, the bar for a move in September appears to be rising amid a gloomy economic outlook. The Bundesbank said on Monday that the German economy may shrink more this year than expected. Moreover, ECB officials have sounded rather dovish in recent days with regard to a move in September.
EUR/USD Weekly Chart
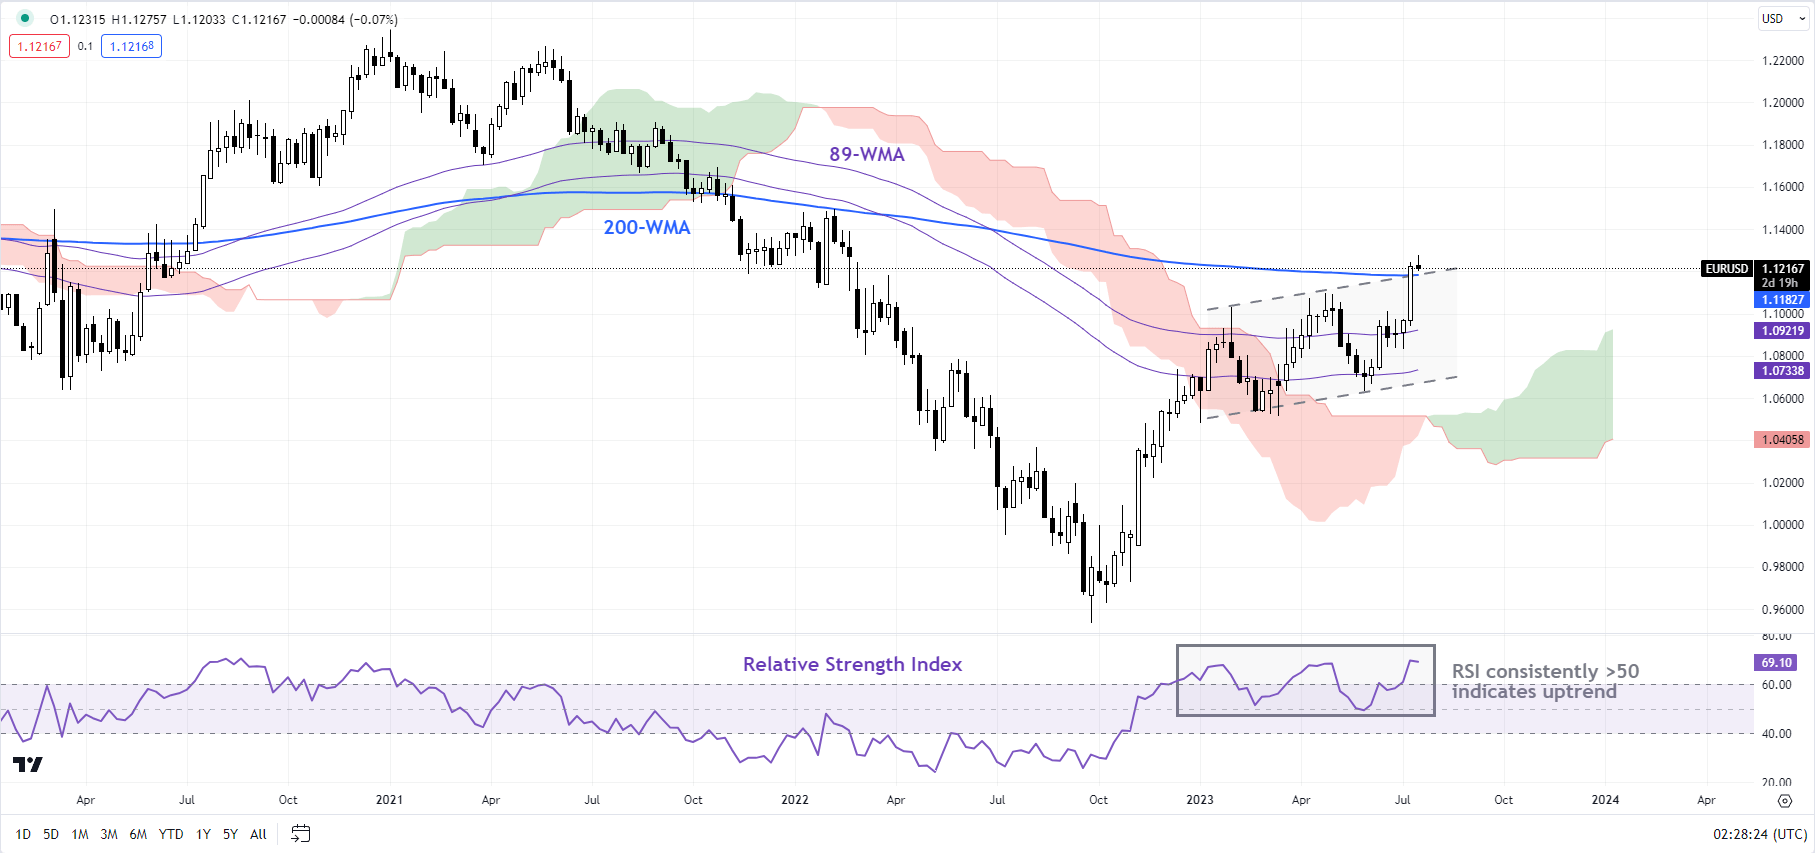
Chart Created by Manish Jaradi Using TradingView
Euro area data have been underwhelming in recent months, with the Euro area Economic Surprise Index at the lowest level since mid-2020. Part of the deterioration in the Euro area outlook reflects the uneven post-Covid recovery in China. Analysts have downgraded Chinese economic forecasts to the weakness in domestic demand and the slowdown in the property sector.
From a monetary policy perspective, both the US Fed and ECB could proceed with a 25-basis point hike next week. However, beyond that whether additional rate hikes happen and to what extent remains uncertain for both central banks. Given the limited relative monetary policy advantage, the path of least resistance to the EUR remains sideways for now from a fundamental perspective.
EUR/USD Daily Chart
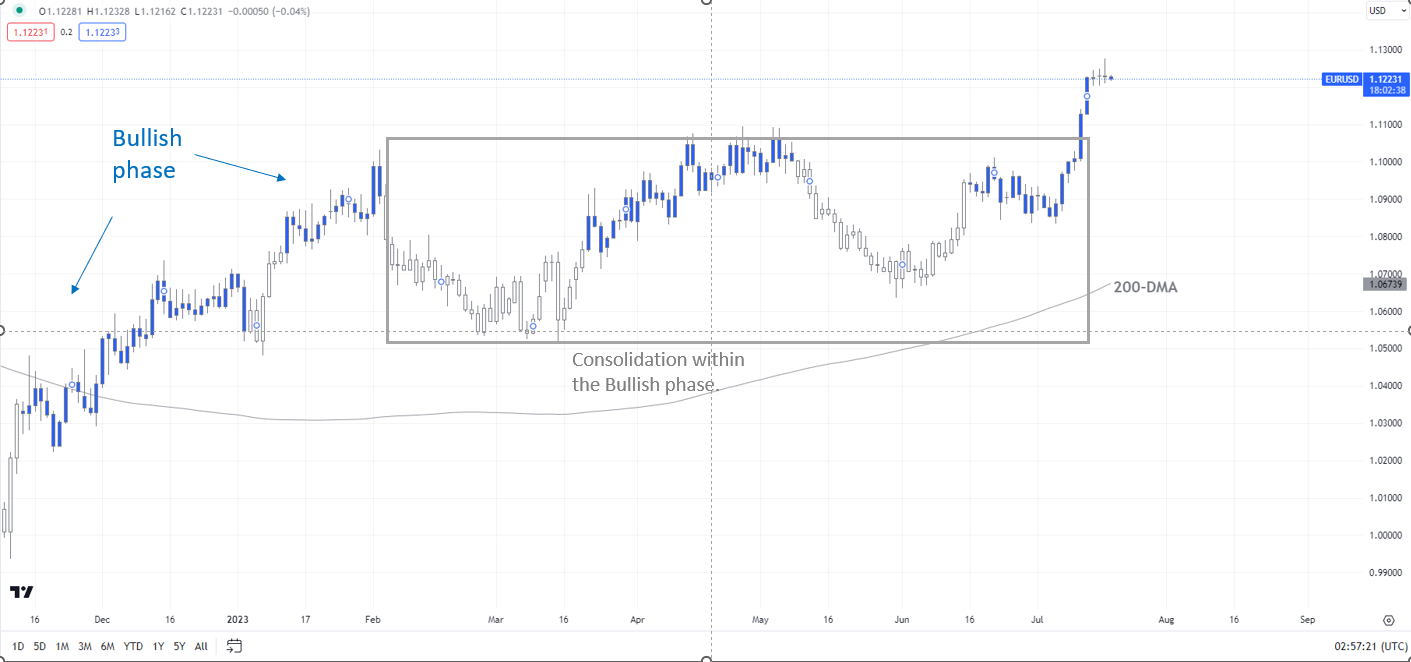
Chart Created by Manish Jaradi Using TradingView; Refer to notes at the bottom.
EUR/USD: At a 16-month high
On technical charts, the broader trend for EUR/USD remains up, as the colour-coded daily candlestick charts show. While the rise to a 16-month high is another sign that the trend remains up, EUR/USD remains capped by key resistance on the upper edge of a rising channel from early 2023, roughly around the 200-week moving average. Still, the upward pressure is unlikely to fade while the pair holds above the June low of 1.0635.
EUR/JPY Daily Chart
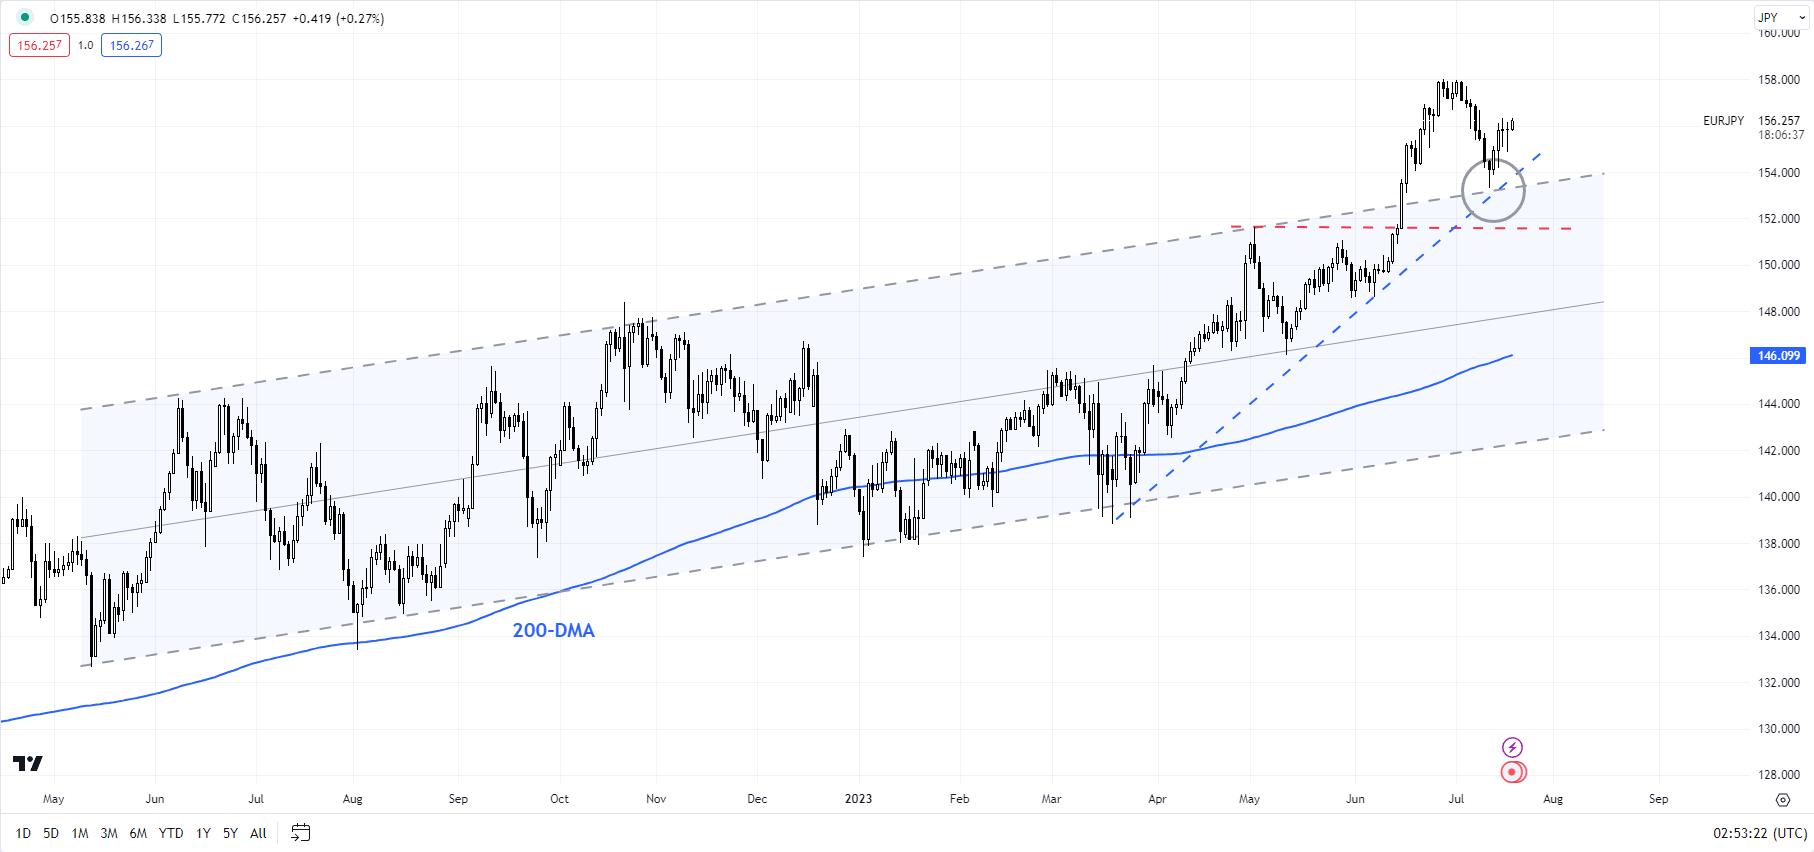
Chart Created by Manish Jaradi Using TradingView
EUR/JPY: Rebounds from key cushion
EUR/JPY has rebounded a key converged cushion, including the upper edge of a slightly upward-sloping channel from last year, and an uptrend line from March 2023. The rebound has opened the door toward the early-July high of 158.00.
EUR/AUD Daily Chart
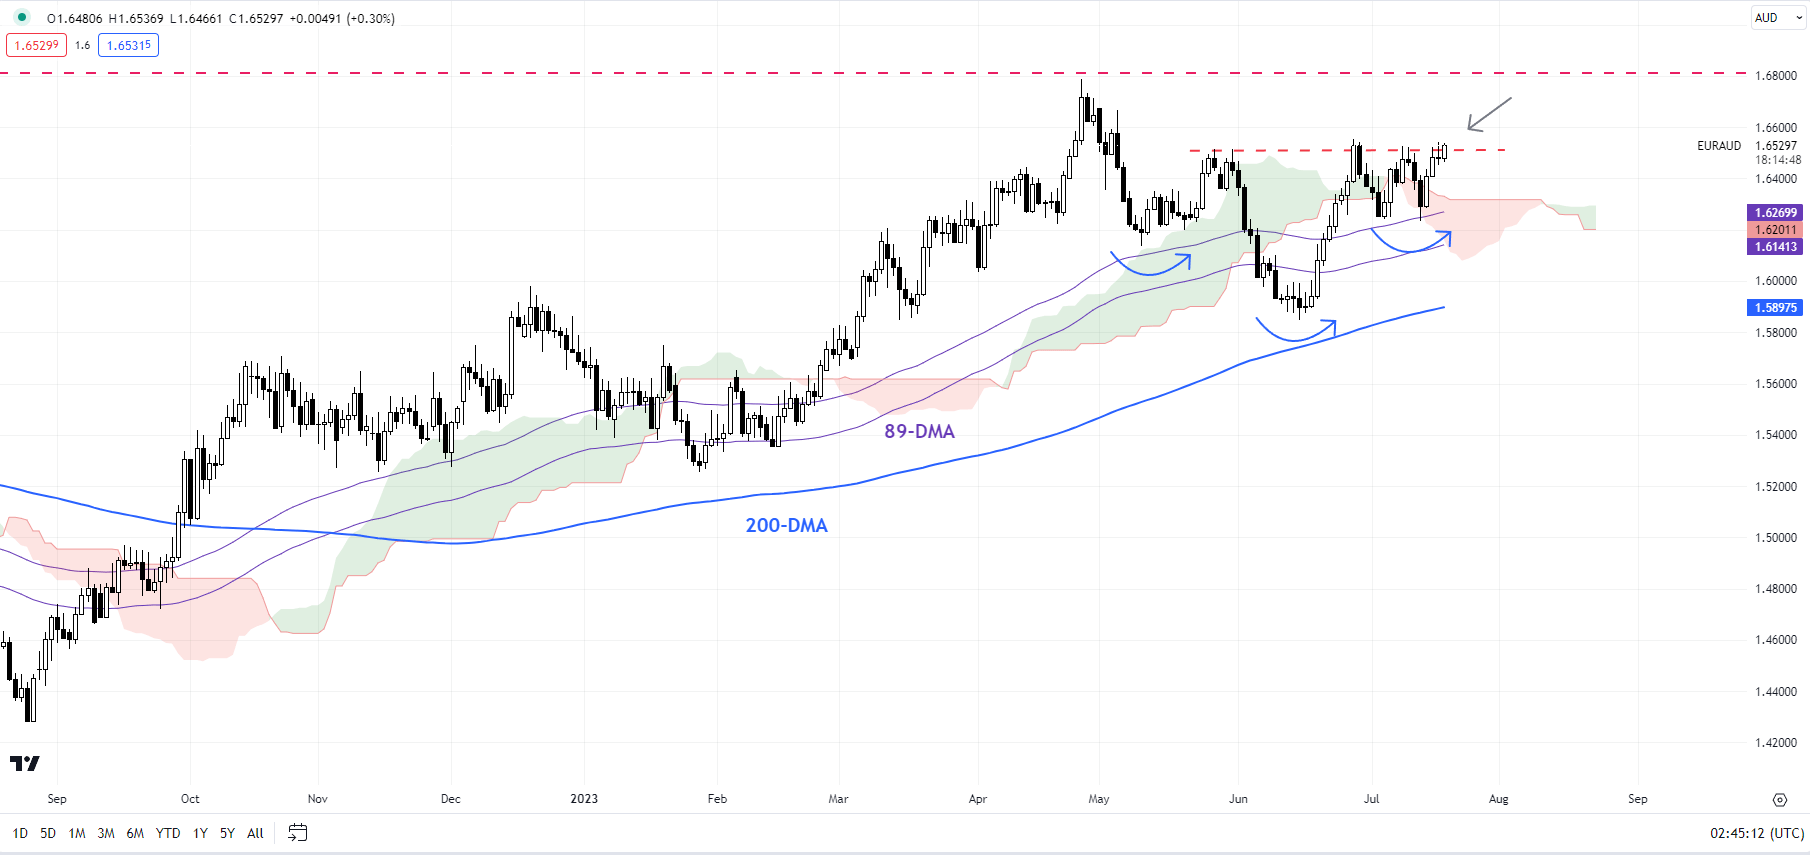
Chart Created by Manish Jaradi Using TradingView
EUR/AUD: Watch resistance
EUR/AUD is testing key resistance on a horizontal trendline from May (at about 1.6515). Any break above could push up the cross toward the April high of 1.6785. However, any break below immediate support at last week’s low of 1.6230 could trigger a drop toward the 200-day moving average (now at about 1.5900).
Note: The above colour-coded chart(s) is(are) based on trending/momentum indicators to minimize subjective biases in trend identification. It is an attempt to segregate bullish Vs bearish phases, and consolidation within a trend Vs reversal of a trend. Blue candles represent a Bullish phase. Red candles represent a Bearish phase. Grey candles serve as Consolidation phases (within a Bullish or a Bearish phase), but sometimes they tend to form at the end of a trend. Candle colors are not predictive – they merely state what the current trend is. Indeed, the candle color can change in the next bar. False patterns can occur around the 200-period moving average, around a support/resistance, and/or in a sideways/choppy market. The author does not guarantee the accuracy of the information. Past performance is not indicative of future performance. Users of the information do so at their own risk.

--- Written by Manish Jaradi, Strategist for DailyFX.com
--- Contact and follow Jaradi on Twitter: @JaradiManish