

Equities Fourth Quarter Recap – A Sigh of Relief to Wrap Up 2022
The Dow Jones, S&P 500 and Nasdaq 100 rallied into the end of the fourth quarter of 2023. The 18%+ decline that year for the S&P 500 was the worst since the global financial crisis of 2008. The highest inflation in 40 years triggered the Federal Reserve to embark on aggressive tightening, raising interest rates to cool inflation. That came at the cost of equities. But the anticipation of slowing tightening in 2023 helped propel stock markets as we wrapped up 2022. Is this wishful thinking?
S&P 500 Quarterly Performance
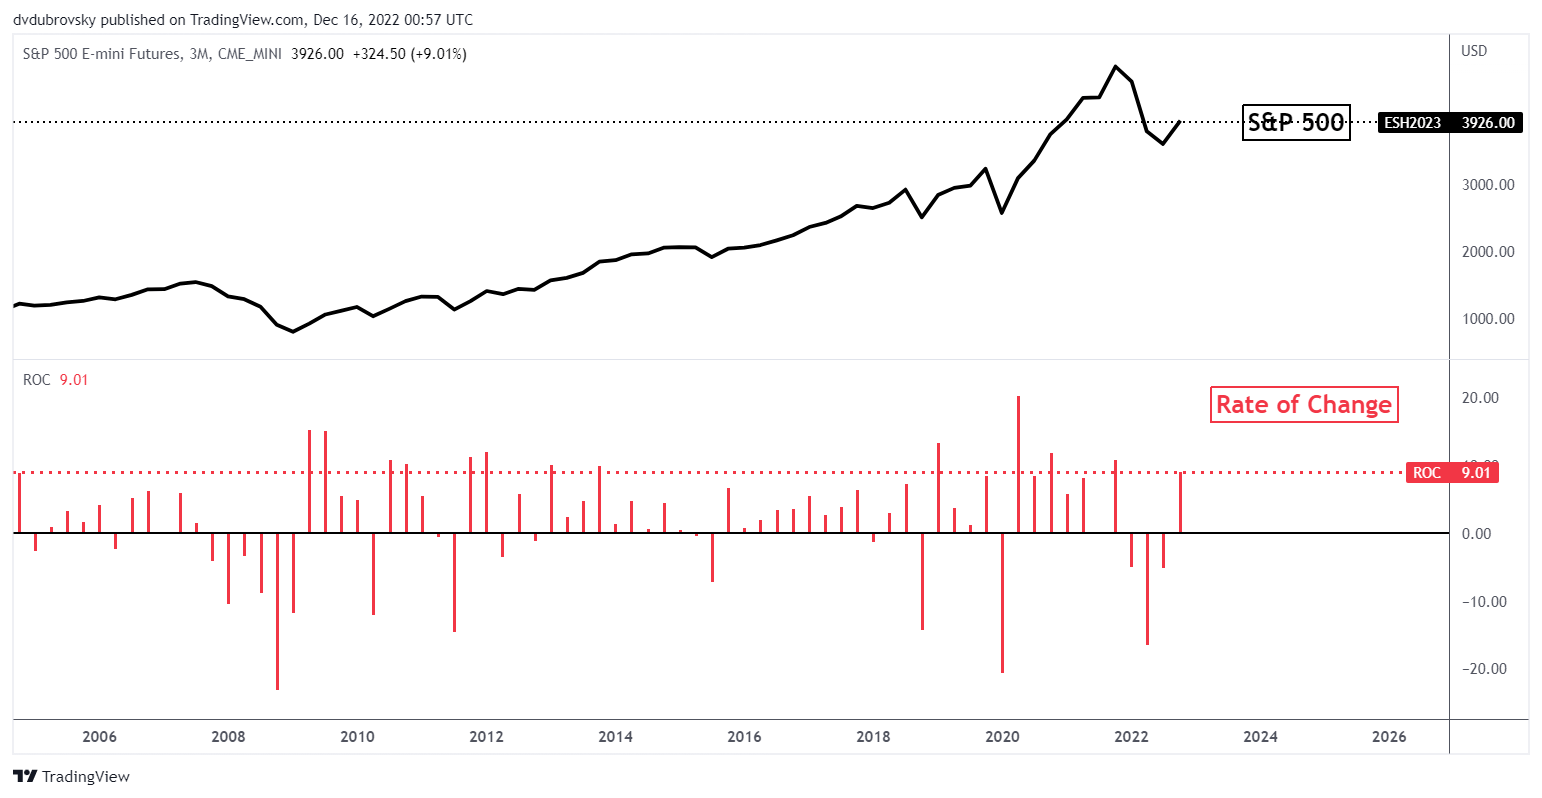
Source: TradingView
What Will Make the First Quarter Important?
Watching the Federal Reserve remains the most important factor for driving the stock market. After December’s rate decision, a disparity emerged between the market and Fed projection for interest rates. Looking at overnight index swaps, the implied rate by the end of 2023 is about 4.4%. This is versus a median 5.125% estimate according to the FOMC dot plot. Who will be right?
To get a better idea, let’s look at where inflation is going. As of November’s US non-farm payrolls report, the labor market remains tight. Labor force participation never recovered from pre-pandemic levels and wage growth remains strong. So, while food and energy prices have been cooling, core readings could stay elevated absent a surge in participation.
In the next chart below, the gap between headline and core US inflation is measured. Since June, general inflation has been cooling a lot more quickly than underlying price pressures. Meanwhile, the shelter component of CPI, which is the largest segment, continues to trend upward and is now outperforming core CPI. That may make it hard for the Fed to bring down inflation without inducing a recession. But, we also know that shelter is a laggy component of CPI.
Watching the Inflation Gap
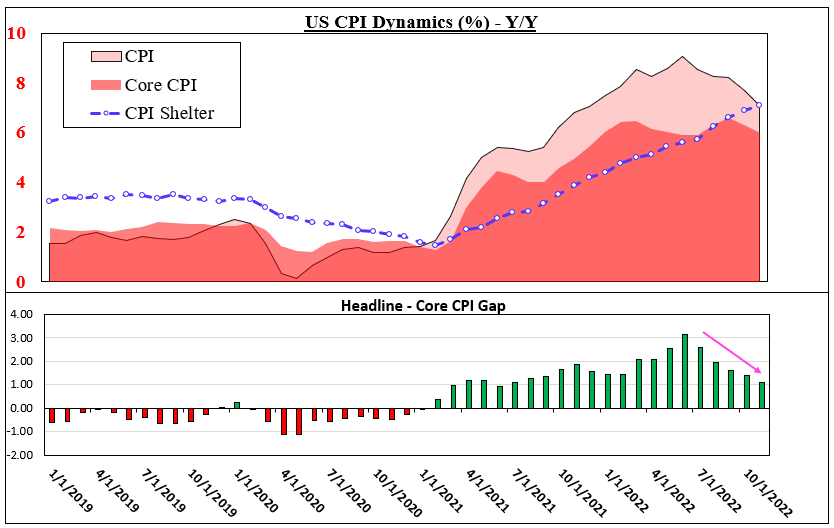
Data Source: Bloomberg, Chart Created by Daniel Dubrovsky
When Will US CPI Shelter Peak and What Does That Mean for Equities?
To get an idea of when the shelter component might start taking a turn lower and help bring down inflation, we can try and use timely data on the housing market and apply a lag to it. The last chart below is a model that tries to predict US CPI shelter by lagging the Zillow US Home Value Index by 12 months. In other words, 2022 November’s CPI shelter print was estimated using the Zillow value from November 2021.
The data seems to show the shelter component peaking between March – April 2023. After that, it takes a rapid nosedive. It should be noted that by November 2023, the model still estimates CPI shelter around 4.4%. Meanwhile, actual CPI shelter has been outperforming the model in recent months. All this paints a Fed that may remain more hawkish than market projections. That is a recipe for stock market volatility, keeping the outlook bearish.
Trying to Take the Lag Out of CPI Shelter
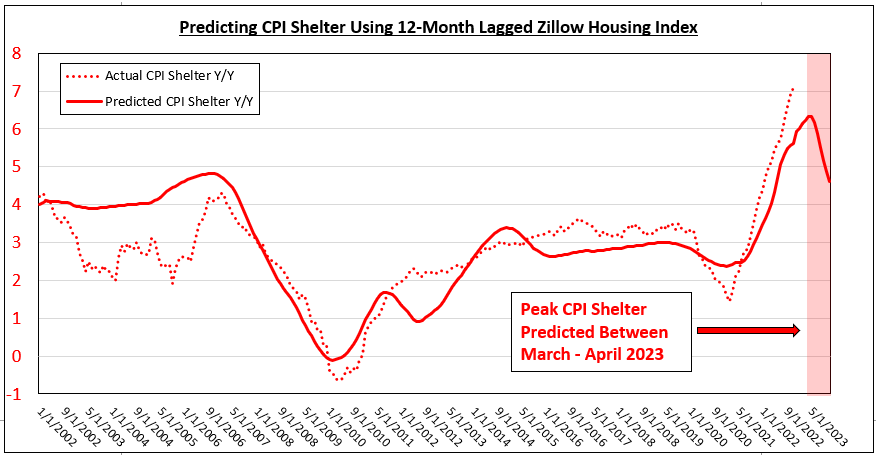
Data Source: Bloomberg, Chart and Model Created by Daniel Dubrovsky