Article by IG Chief Market Analyst Chris Beauchamp
Dow Jones, CAC40, Nikkei 225 Analysis and Charts

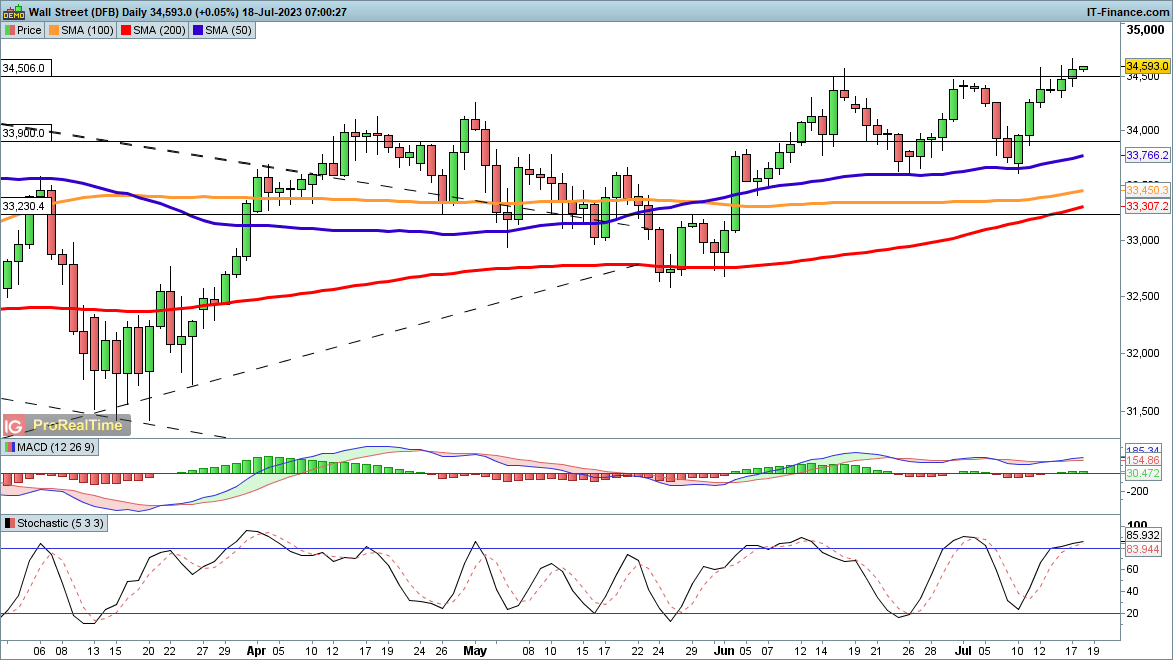
Dow pushes up ahead of bank earnings.
Further gains have taken the price back to 34,500, and a break to a new high for the year could be in the offing.Additional upside from current levels would then target 34,940, 35,493, and then 35,860. This would continue to recoup the losses from the first months of 2022, and mark a more substantial recovery for the index.
The recent double-bounce from the 50-day SMA has left the buyers firmly in charge, and a move back below the 50-day would be needed to negate the bullish outlook.
Dow Jones Daily Price Chart

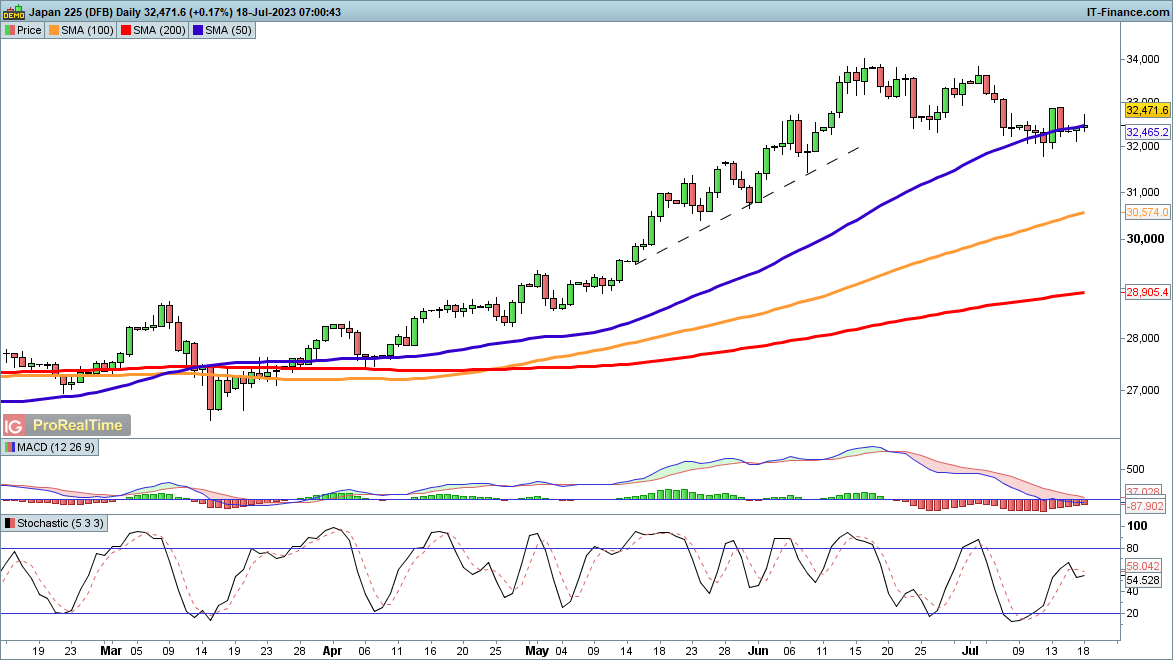
Nikkei 225 struggles around the 50-day MA.
Dips towards 32,000 continue to bring out buyers, and for the moment the pullback has failed to make new lows. Sellers will want to see a daily close below 32,000, something they have been unable to achieve over the past week. This might then point to further declines that will see the price eat into the gains of May.
A recovery above 33,000 would add weight to the view that a higher low has been created and that a fresh leg higher in the index’s uptrend has begun. This might then target 33,840 and 34,000.
Nikkei Daily Price Chart
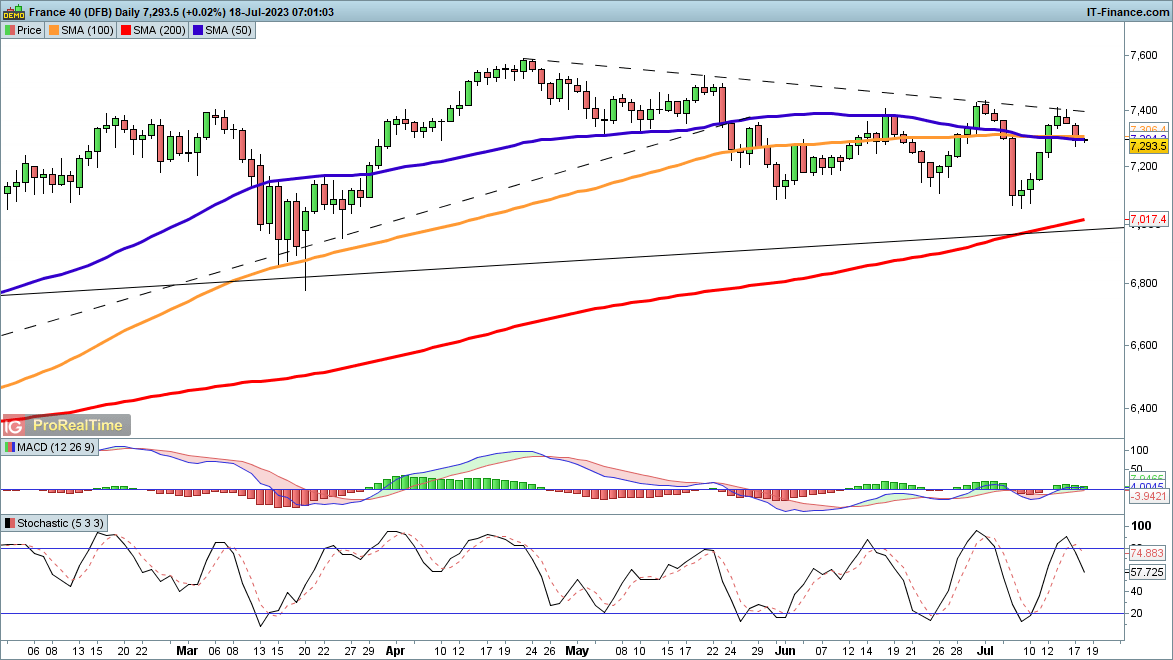
CAC40 edges higher.
The index has been unable to make headway today, and the drop from trendline resistance is intact. For the moment this leaves the pullback from the April high in play, and could see the price head back to the July low around 7070. Below this, the 200-day SMA comes into view as a target.
A close above 7400 is needed to suggest that a more bullish view prevails and that trendline resistance has been broken.
CAC40 Daily Price Chart