

Will the British Pound Recovery Continue into Q1 2023?
The British Pound has posted significant gains against both the Euro and the US Dollar since printing its YTD low in the aftermath of the Kwasi Kwarteng budget announcement. The optimism around the Pound continued following the appointment of PM Rishi Sunak and the autumn statement by Chancellor Jeremy Hunt. GBPUSD has recovered more than 50% of the year’s losses with the majority of the recovery taking place in Q4. The only factor that could come into play for GBPUSD would be the risk of exhaustion as we have rallied some 700-odd pips since breaking the 2022 descending trendline without any significant retracement.
Chart of GBPUSD Weekly
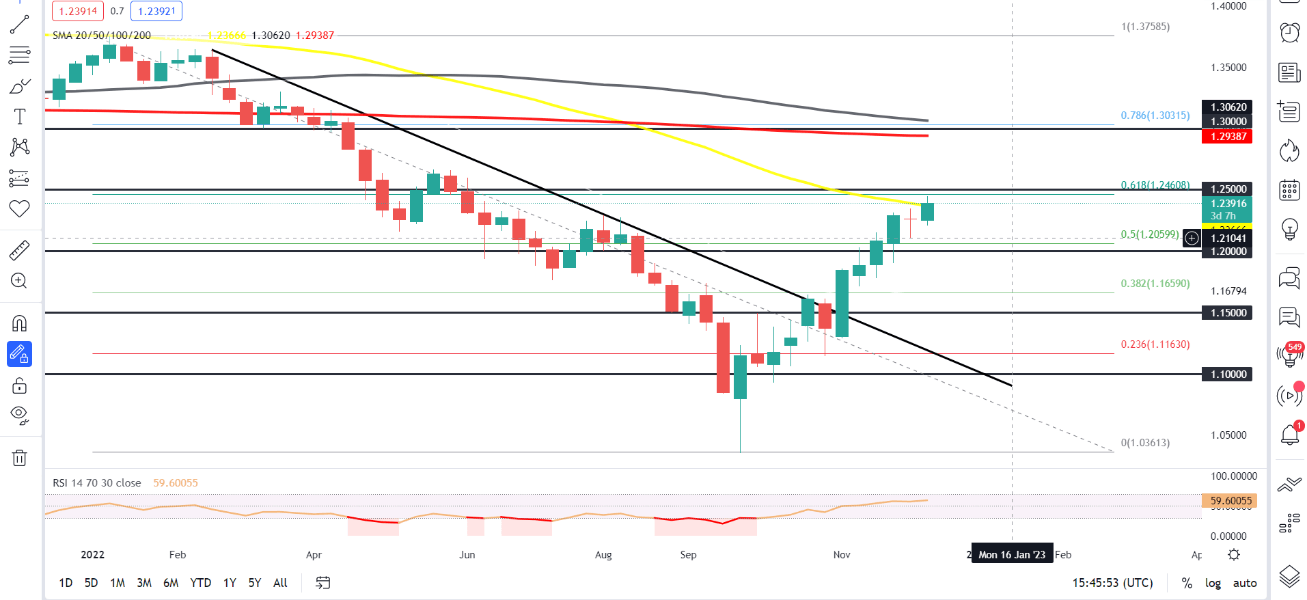
Source: TradingView, Prepared by Zain Vawda
GBPUSD has continued its renaissance in Q4 with the dollar index experiencing a retracement as well. We have seen a continued push higher with GBPUSD now firmly trading above the 1.2000 psychological level. Since breaking the descending trendline in early November the pair has gained some 700-odd pips before finding resistance around the 50-day MA. A break and candle close above the 50-day MA could see a test of resistance around the 1.2500 level which lines up with the 61.8% fib level. A break above 1.2500 opens up a possibility of a retest of the May 2022 swing high around the 1.2635 area. The RSI is currently at the 60 level with a push to the May 2022 swing high likely to see us enter overbought territory posing the risk of retracement. Any form of pullback or retracement from current prices will likely result in a test of the 50% fib level around 1.2060 before the key psychological level at 1.2000. A break and candle close below 1.20000 brings the 38.2% fib level into play around 1.1659.
Key resistance levels: 1.2500, 1.2625, 1.2750, 1.3000
Key support levels: 1.2060, 1.2000, 1.1750, 1.1659
Chart of EURGBP Weekly

Source: TradingView, Prepared by Zain Vawda
EURGBP on the weekly chart above provides an indication of price action at its best, as we have printed lower highs and lower lows since posting our YTD high in late September. Significant support rests just below current price with both the 50 and 100-day MA resting above the 0.8500 handle. Having printed a new lower low there is a possibility of a short-term pullback to create a new lower high before pushing further down and a possible test of the ascending trendline. However, a candle break and close above the lower high at 0.87600 would invalidate the bearish setup. Alternatively, a break and close below the ascending trendline could see the pair test the 2022 YTD lows around the 0.82000 level.
Key resistance levels: 0.8700, 0.8780, 0.8905, 0.9114
Key support levels: 0.8500, 0.8350, 0.82000