

Bitcoin (BTC), Ethereum (ETH), Litecoin (LTC) Technical Forecast
- Bitcoin (BTC/USD) prices trade flat while the weekly RSI (relative strength index) flirts with oversold territory.
- Ethereum (ETH/USD) drifts lower - prices dip below $1200.
- Litecoin (LTC/USD) jumps over 5% - prices retest $60.

Bitcoin Technical Analysis
Bitcoin prices are on track to end the week in the green after last weeks brutal sell-off resulted in 21.99% decline in value. With the November low setting a fresh yearly low, the dramatic shift in sentiment over the past 12 months highlights the changes in the fundamental backdrop.
Visit the DailyFX Educational Center to discover how macro fundamentals impacts markets
With the ongoing investigation into FTX and founder Sam Bankman-Fried, BTC/USD price action has eased into a narrow range. As a doji candle forms on the weekly chart, the weekly open continues to provide psychological support at $16300 while the November low holds as the next big support level at $15632.
Bitcoin (BTC/USD) Weekly Chart
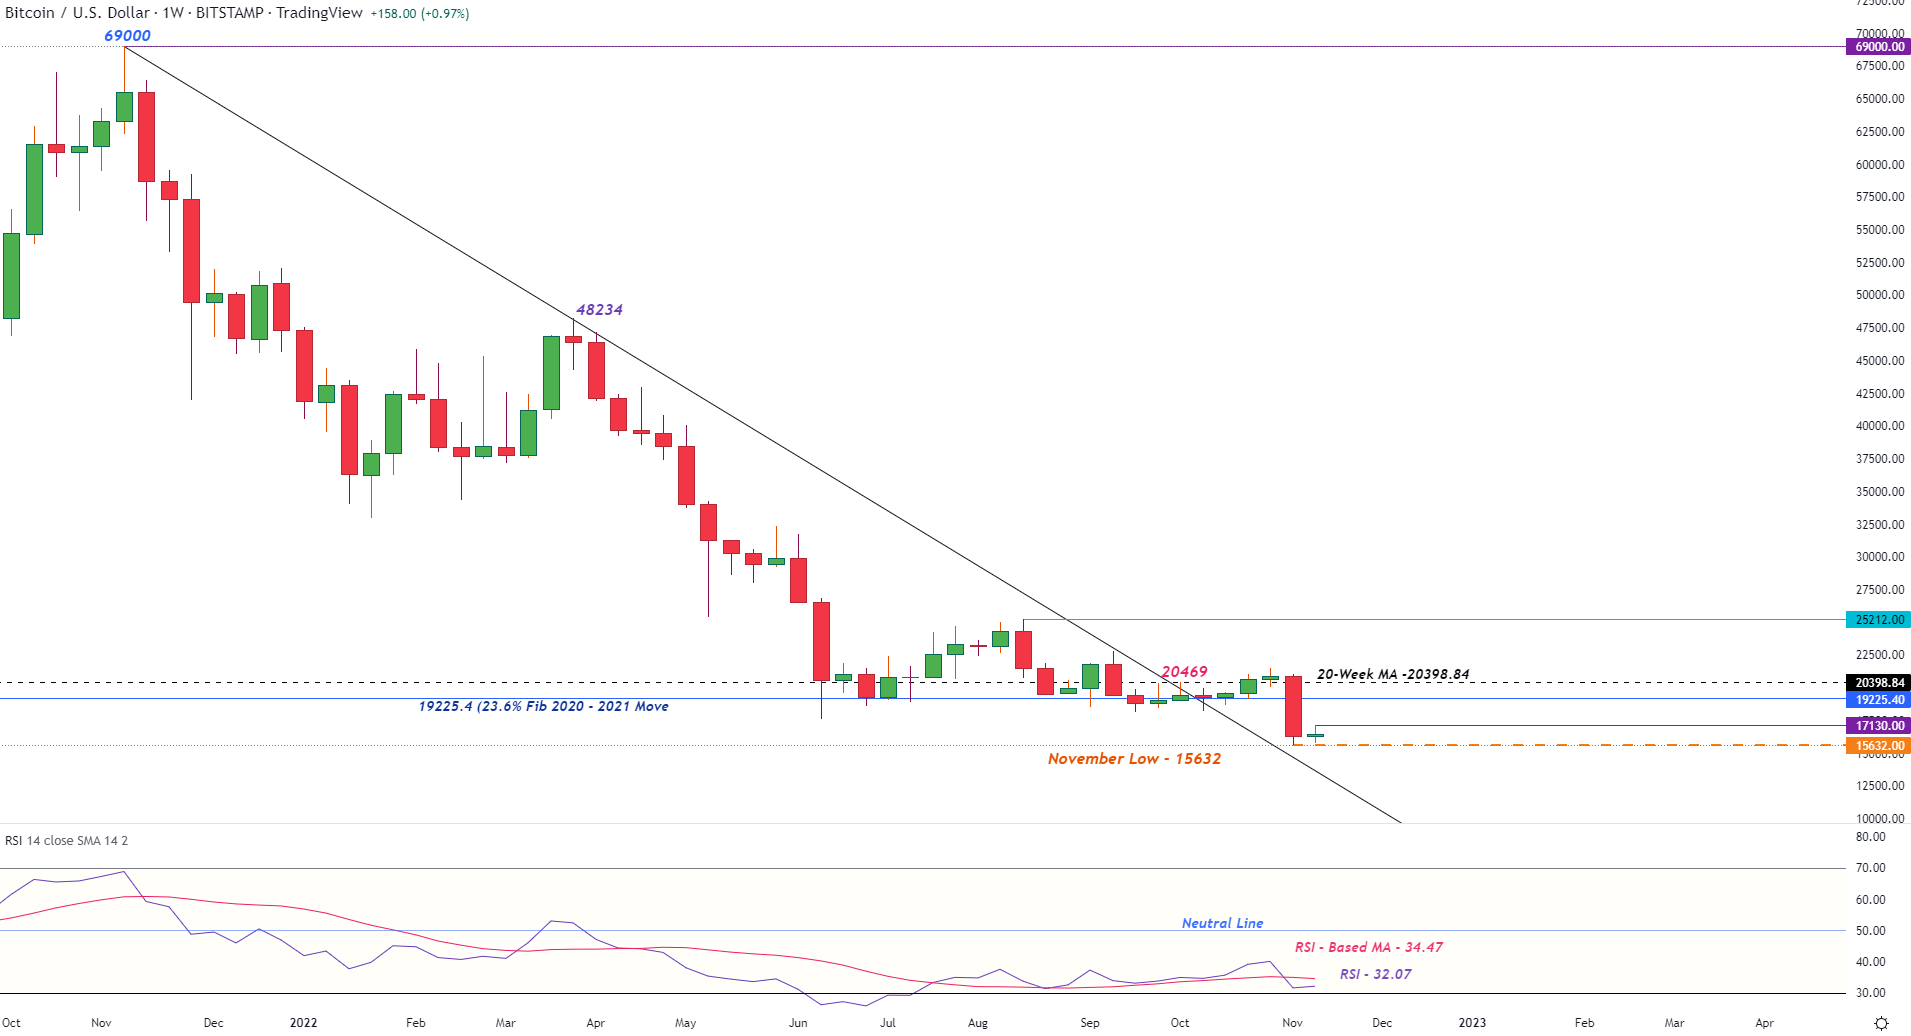
Chart prepared by Tammy Da Costa using TradingView

As the weekly RSI heads towards oversold territory, the daily chart illustrates the near-term resistance at the 13 November high of $17240 which could see BTC rise back towards $180000.
Bitcoin (BTC/USD) Daily Chart
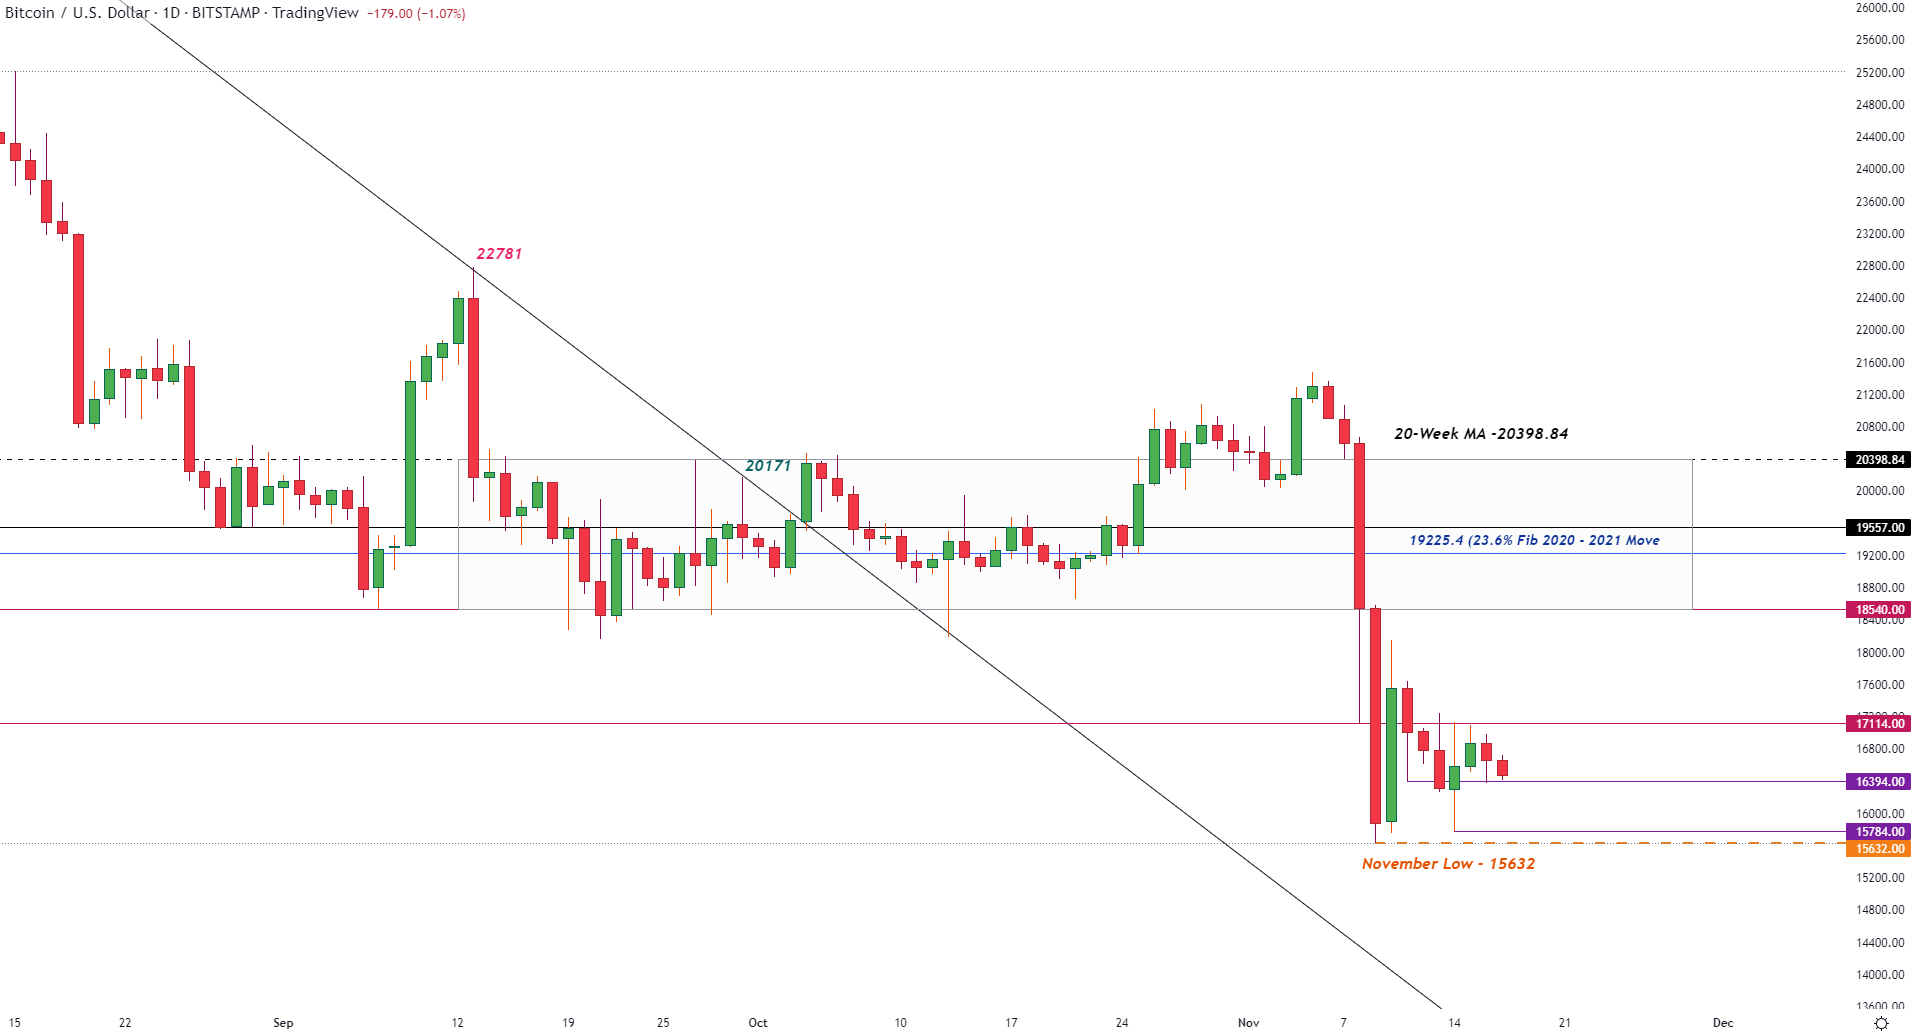
Chart prepared by Tammy Da Costa using TradingView
Ethereum (ETH/USD) Technical Analysis
Ethereum is currently down roughly 1.5% (at the time of writing) as prices briefly did below $1200. As the 23.6% Fibonacci of the 2020 – 2021 move comes in as resistance at $1216.42, the October low holds as support at $1155. While price action hovers around the $1200 psych level, a retest of the daily low at $1182.2 could provide bears with more fuel to drive the second largest digital asset lower.
Ethereum (ETH/USD) Daily Chart
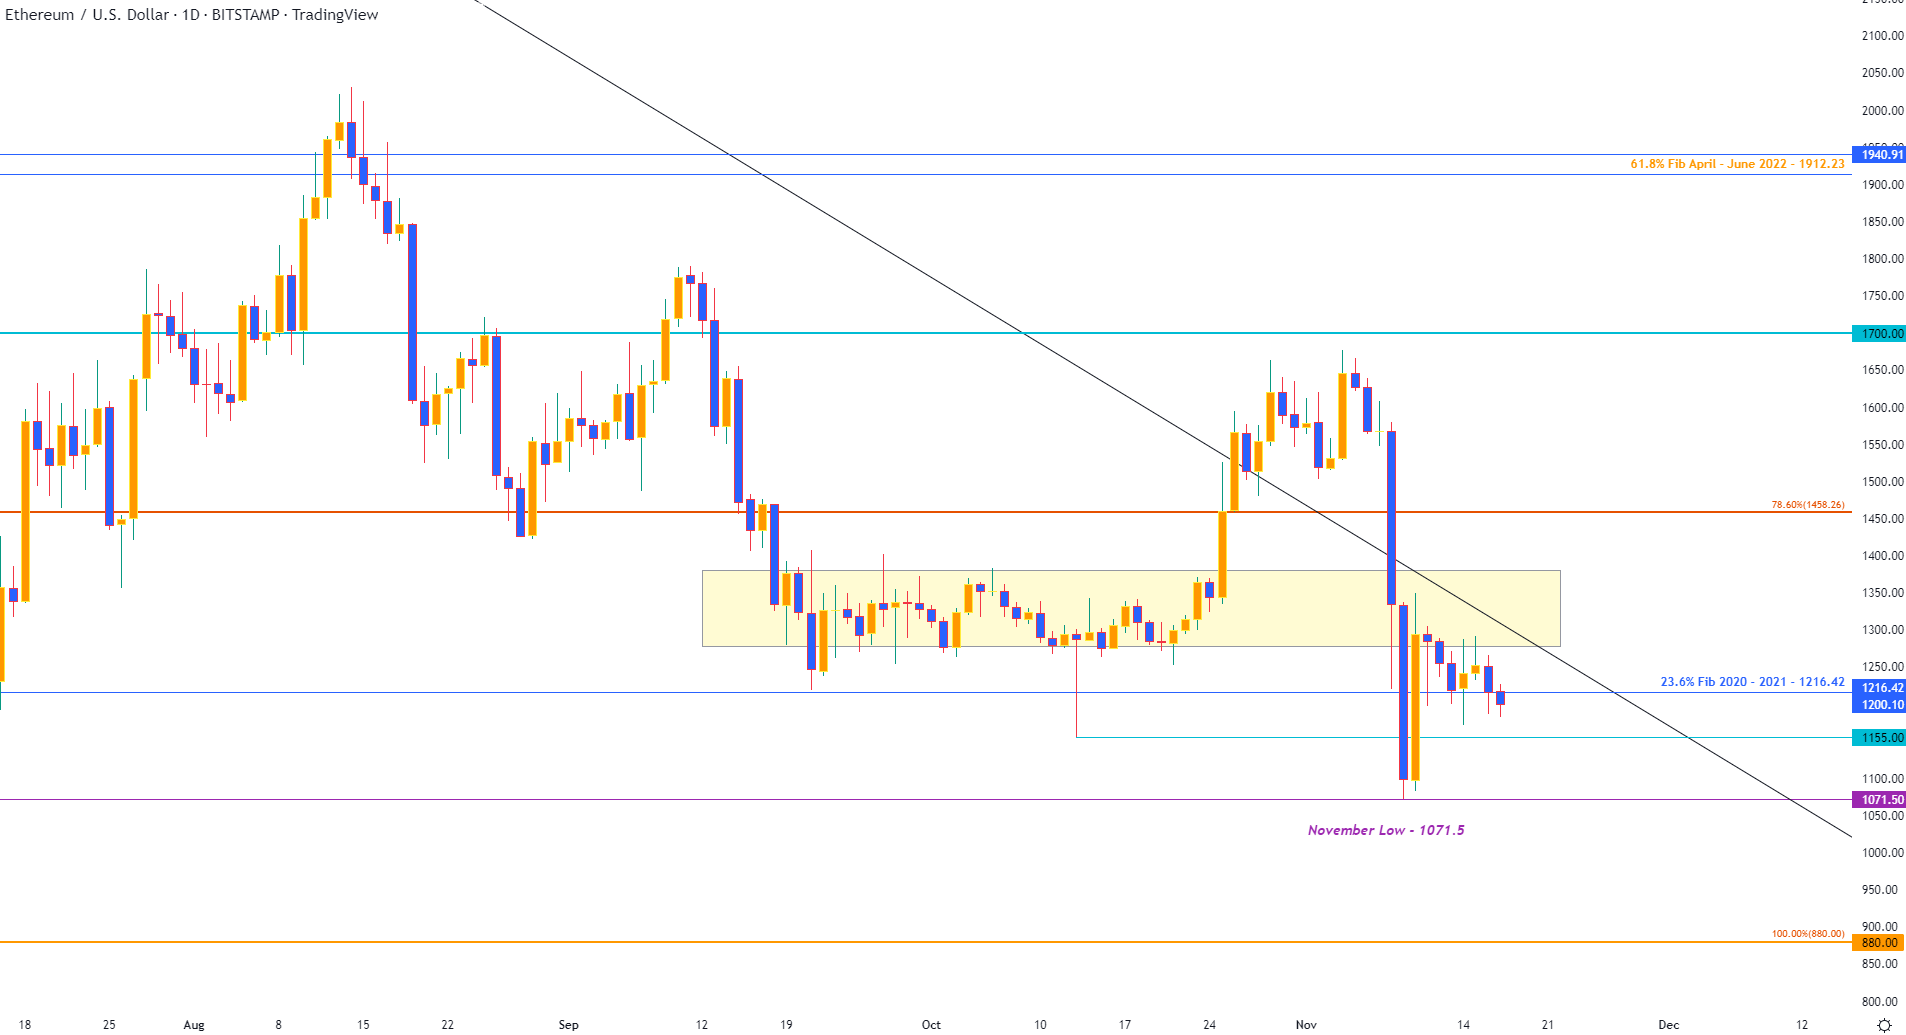
Chart prepared by Tammy Da Costa using TradingView
Litecoin (LTC/USD) Technical Analysis
While its major crypto counterparts struggle to gain traction, Litecoin is trading 5% higher on the day as prices retest $60. A move higher could see prices rise to the 10 November high of $61.08 with a break above bringing the next zone of resistance into play at the November 11 high of $64.13.
Litecoin (LTC/USD) Daily Chart
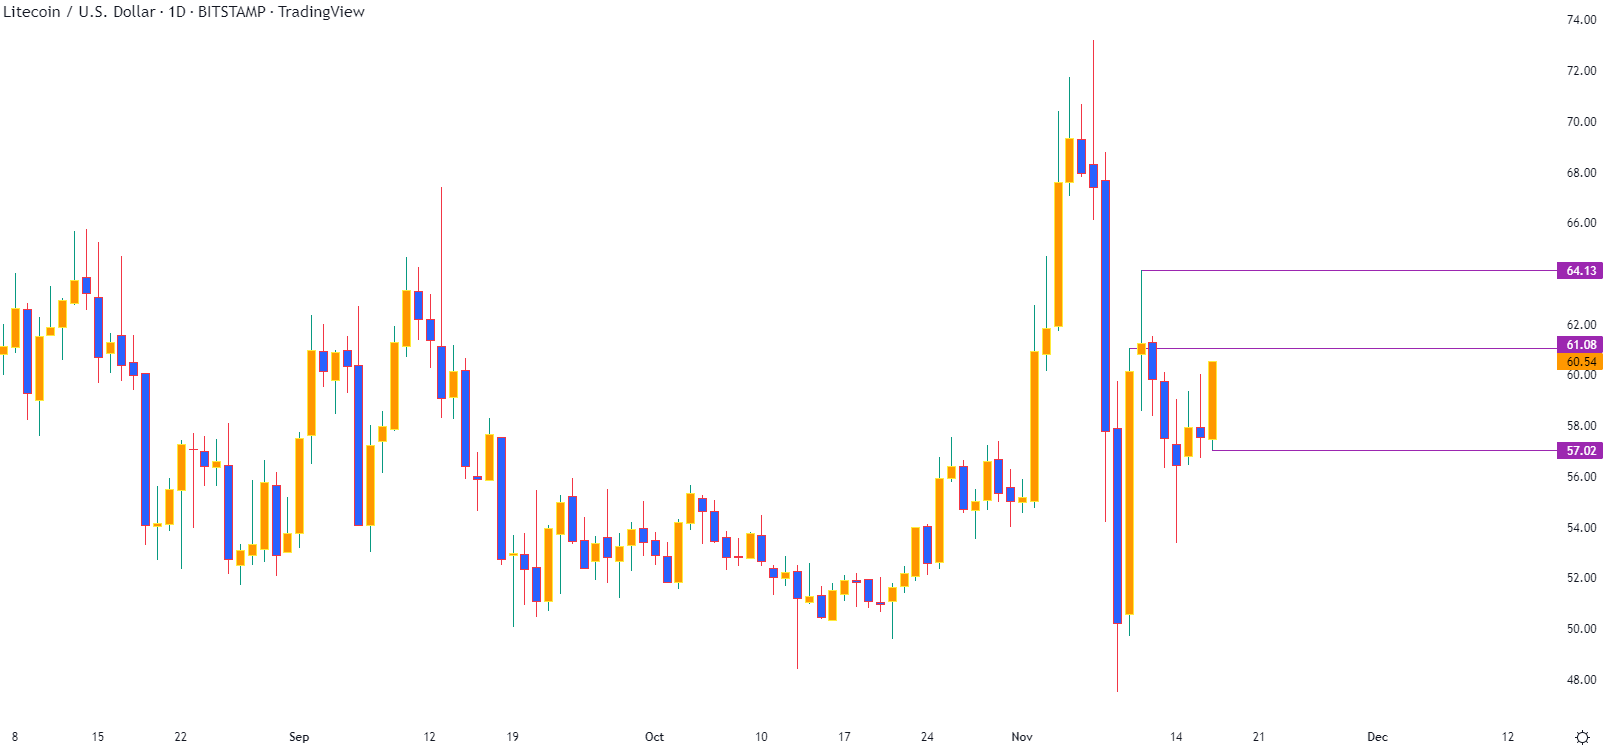
Chart prepared by Tammy Da Costa using TradingView
Trade Smarter - Sign up for the DailyFX Newsletter
Receive timely and compelling market commentary from the DailyFX team
--- Written by Tammy Da Costa, Analyst for DailyFX.com
Contact and follow Tammy on Twitter: @Tams707