
AUD/JPY
AUD/JPY
Mixed
Last updated:
Jul 24, 2023
| Low | |
| High |
of clients are net long.
of clients are net short.
Note: Low and High figures are for the trading day.
The Australian Dollar (AUD) against the Japanese Yen (JPY) is an exciting pair for its relation to risk. The pair is often among one of the most highly correlated pairs to price action in US equities on a short to medium term basis. The pair generally tends to rise in a low risk environment on carry flows while the opposite is true when we see a 'risk-off' approach in the markets.
Advertisement
News & Analysis

Japanese Yen Steady After CPI; USD/JPY, AUD/JPY, CAD/JPY, MXN/JPY Price Action
2023-07-21 06:00:00

Profit-Taking in Big Tech Overnight, as US Earnings Remain Centre Stage: US Dollar, Nikkei 225, AUD/JPY
2023-07-21 02:00:00

Australian Dollar Leaps on Hot Jobs Data Ahead of CPI. Where to for AUD/USD?
2023-07-20 01:30:00
Sentiment Awaiting Cues from Key US Earnings Releases Ahead: Brent crude, AUD/JPY, Natural Gas
2023-07-18 02:00:00
Australian Dollar Skips a Beat on New RBA Governor Michele Bullock's Appointment
2023-07-14 00:00:00
Australian Dollar Outlook: Central Banks Continue to Grapple with CPI
2023-07-07 20:00:00
Japanese Yen Aided by Jump in Japan Wages: USD/JPY, EUR/JPY, AUD/JPY Price Setups
2023-07-07 03:00:00
Real Time News

Jul 18, 2023
Follow
🇺🇸 Net Long-term TIC Flows (May)
Actual: $25.8B
Expected: $110.2B
Previous: $127.8B
https://www.dailyfx.com/economic-calendar#2023-07-18
Jul 18, 2023
Follow
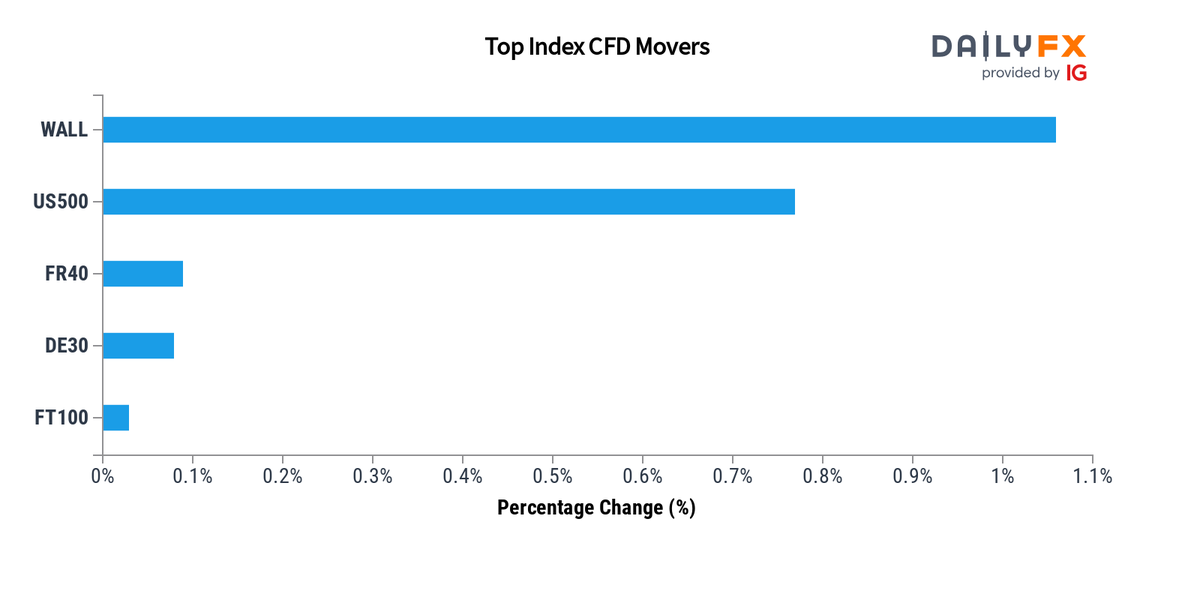
Indices Update: As of 20:00, these are your best and worst performers based on the London trading schedule:
Wall Street: 1.06%
US 500: 0.77%
France 40: 0.09%
Germany 40: 0.08%
FTSE 100: 0.03%
View the performance of all markets via https://www.dailyfx.com/forex-rates#indices https://t.co/ts7HI7zcYb
Jul 18, 2023
Follow
Heads Up:🇺🇸 Net Long-term TIC Flows (May) due at 20:00 GMT (15min)
Expected: $110.2B
Previous: $127.8B
https://www.dailyfx.com/economic-calendar#2023-07-18

Jul 24, 2023
Follow

