The downside surprise in US inflation paved the way for more gains in Wall Street overnight (DJIA +0.25%; S&P 500 +0.74%; Nasdaq +1.15%), as the S&P 500 and Nasdaq found a new high since April 2022 and January 2022 respectively. Indication of market relief was reflected with an 8.7% plunge in the S&P 500 VIX, with the index widening the gap below its key 20 level and keeping a risk-on environment in place.
Promising inflation progress in the US was displayed in the 3% read for the headline consumer price index (CPI) year-on-year versus the 3.1% expected. More importantly, the core reading came in at its lowest level since December 2021, with a 4.8% print coming in below the 5% forecast (previous 5.3%). This marked the first downside surprise in US core inflation in seven months. Month-on-month, both headline and core inflation came in at 0.2% (0.3% expected).
Almost all the CPI components saw a moderation in year-on-year price growth compared to June 2022, more notably with energy and used cars prices. The only exception is in shelter prices, but given that the Fed is placing less attention on it due to the component’s lagging nature, its persistent showing did not bring much concern.
Overall, the lower-than-expected read in US inflation suggests that the tightening cycle from the Fed thus far are having its desired effect in moderating pricing pressures. Rate expectations remain well-anchored for one last 25 basis-point (bp) hike from the Federal Reserve (Fed) this month and the case has strengthened for a prolonged pause in tightening thereafter.
The S&P 500 is back to retest a key channel trendline resistance once more, with the formation of a new higher high overnight reiterating its prevailing upward trend. The risk is that any turn lower at current point in time could still put a lower high on its daily Relative Strength Index (RSI), with the bearish divergence pointing to some moderation in upward momentum. That said, the broad trend remains upward-bias, with any downside potentially leaving the 4,330 level on watch for near-term support.
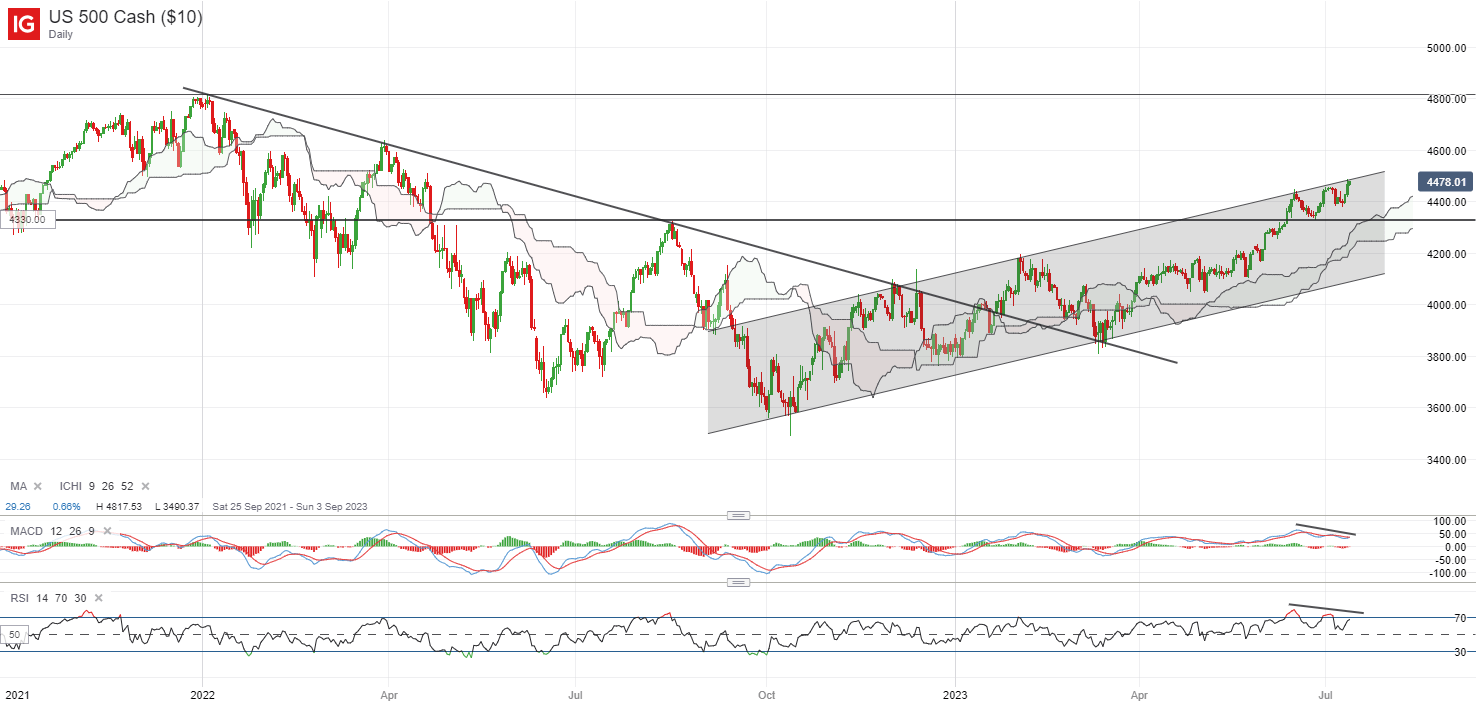
Source: IG charts
Asia Open
Asian stocks look set for a positive open, with Nikkei +0.61%, ASX +1.32% and KOSPI +0.78% at the time of writing, coming off the back of abating inflation fears in the US. The Nasdaq Golden Dragon China Index is up 3.4% overnight. Economic data this morning saw a downside surprise in New Zealand’s manufacturing activities from its Performance of Manufacturing Index (PMI) (47.5 versus 49.8 consensus), which validates its central bank’s decision to revert to a rate pause yesterday on higher economic risks.
The day ahead will leave China’s trade data in focus to provide further gauge of economic conditions in the world’s second largest economy. Still-weak external demand is expected to drag its year-on-year exports further into contractionary territory at -9.5% versus the previous 7.5%. On the other hand, imports are expected to contract to a lesser extent at -4% versus the previous -4.5%, but it will be unlikely to provide much conviction for a clear recovery in place. The overall weak showing in trade activities, in line with the recent subdued inflation data, may still reinforce hopes for more to be done.
Thus far, the China A50 index has been trading within a descending triangle pattern since November last year, with the base potentially formed at the 12,300-12,375 range. With the index inching closer towards the triangle apex, a key decision may have to be made, where the downward trendline resistance will challenge buyers while the triangle base support will serve as support for sellers to overcome. Any breakdown of the 12,300 level to a new lower low could reinforce its prevailing downward trend and potentially leave its November 2022 bottom on watch for a retest.
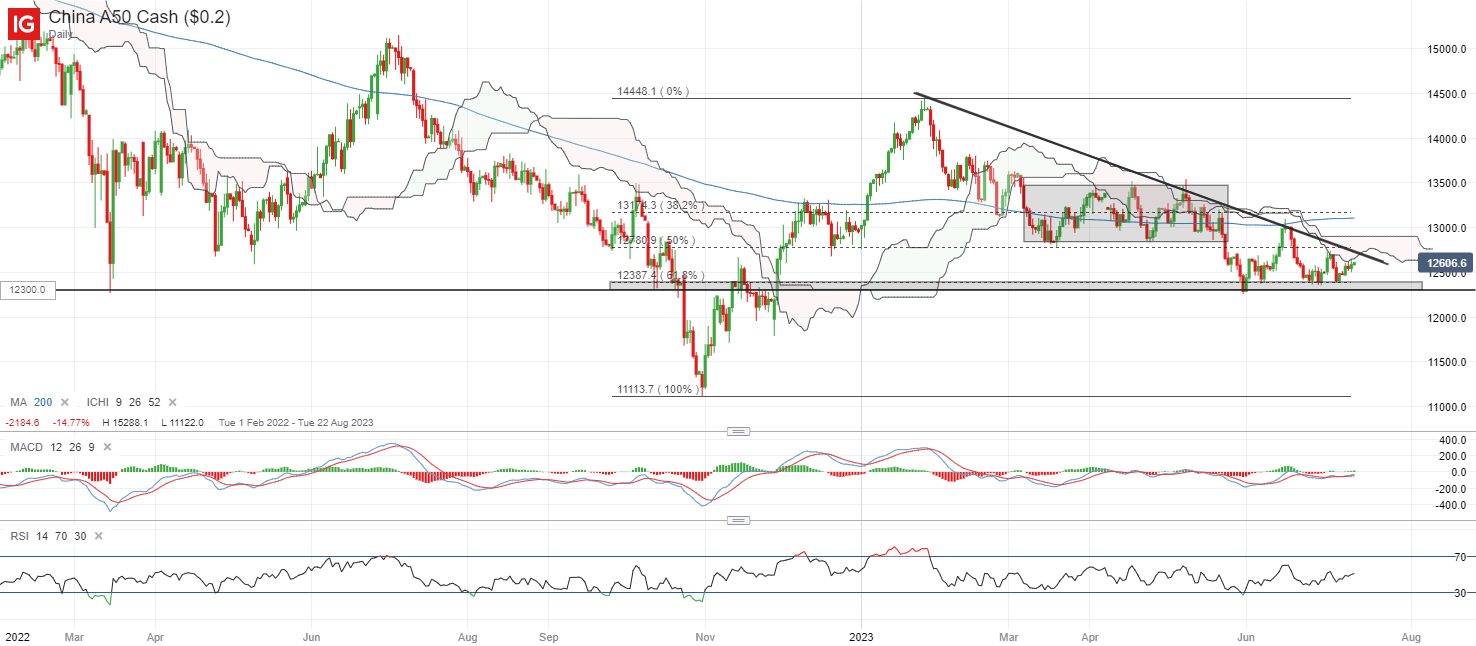
Source: IG charts
On the watchlist: US dollar index plunged to a new 14-month low
US Treasury yields reacted sharply to the downside in the aftermath of the lower-than-expected US inflation read, which dragged the US dollar index to its lowest level since April 2022. On the technical end, its moving average convergence divergence (MACD) has reversed lower on the daily chart after failing to cross above the key zero line this week, while the RSI was also dragged further below the key 50 level, both reinforcing bearish momentum in place.
After attempting to stabilise and form a base since February this year, the breakdown to a new lower low seems to strengthen the case for a continuation of the broader downward trend. The 100.50 level will now turn into a previous support-turned-resistance level to overcome, while further downside may leave the 99.00 level on watch next.
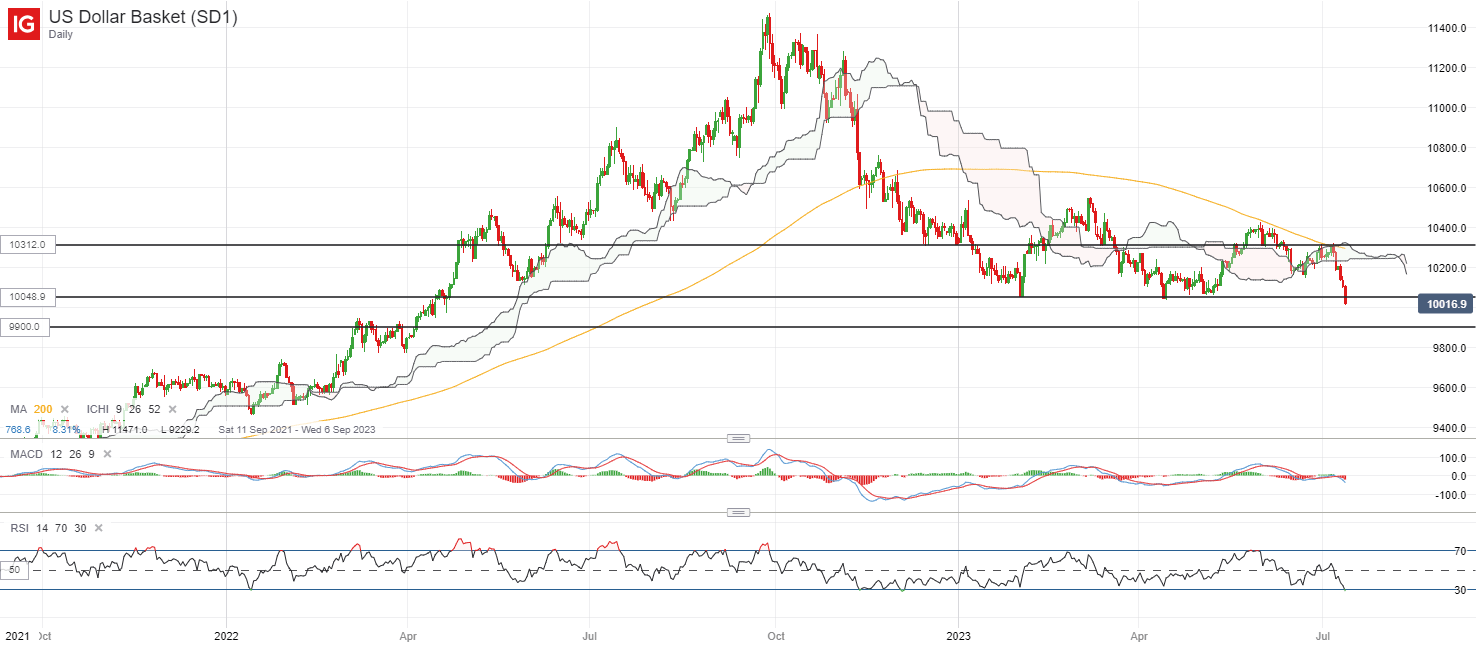
Source: IG charts
Wednesday: DJIA +0.25%; S&P 500 +0.74%; Nasdaq +1.15%, DAX +1.47%, FTSE +1.83%